GoiTbill 91D280325_TB full analysis,charts,indicators,moving averages,SMA,DMA,EMA,ADX,MACD,RSIGoi Tbill 91D280325_TB WideScreen charts, DMA,SMA,EMA technical analysis, forecast prediction, by indicators ADX,MACD,RSI,CCI NSE stock exchange
Daily price and charts and targets GoiTbill Strong Daily Stock price targets for GoiTbill 91D280325_TB are 98.97 and 99.39 | Daily Target 1 | 98.62 | | Daily Target 2 | 98.9 | | Daily Target 3 | 99.04 | | Daily Target 4 | 99.32 | | Daily Target 5 | 99.46 |
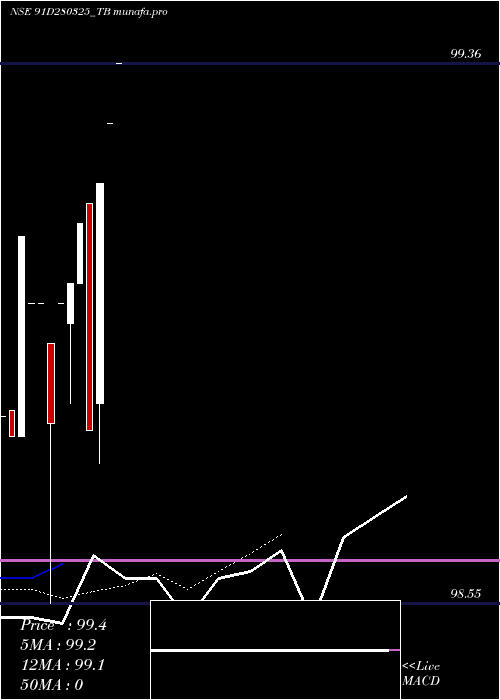
Daily price and volume Goi Tbill
| Date |
Closing |
Open |
Range |
Volume |
Mon 10 February 2025 |
99.18 (0.37%) |
98.85 |
98.76 - 99.18 |
6.1818 times |
Tue 04 February 2025 |
98.81 (-0.31%) |
99.15 |
98.81 - 99.15 |
0.1212 times |
Mon 03 February 2025 |
99.12 (0.09%) |
99.03 |
99.03 - 99.12 |
0.1212 times |
Thu 30 January 2025 |
99.03 (0.03%) |
98.97 |
98.85 - 99.03 |
0.7273 times |
Wed 29 January 2025 |
99.00 (0.18%) |
99.00 |
99.00 - 99.00 |
0.3636 times |
Tue 28 January 2025 |
98.82 (-0.18%) |
98.94 |
98.55 - 98.94 |
0.7879 times |
Mon 27 January 2025 |
99.00 (0%) |
99.00 |
99.00 - 99.00 |
0.303 times |
Fri 24 January 2025 |
99.00 (-0.1%) |
99.00 |
99.00 - 99.00 |
0.6061 times |
Thu 23 January 2025 |
99.10 (0.3%) |
98.80 |
98.80 - 99.10 |
0.6061 times |
Wed 22 January 2025 |
98.80 (-0.03%) |
98.84 |
98.80 - 98.84 |
0.1818 times |
Tue 21 January 2025 |
98.83 (0%) |
98.83 |
98.83 - 98.83 |
0.1818 times |
Weekly price and charts GoiTbill Strong weekly Stock price targets for GoiTbill 91D280325_TB are 98.97 and 99.39 | Weekly Target 1 | 98.62 | | Weekly Target 2 | 98.9 | | Weekly Target 3 | 99.04 | | Weekly Target 4 | 99.32 | | Weekly Target 5 | 99.46 |
Weekly price and volumes for Goi Tbill
| Date |
Closing |
Open |
Range |
Volume |
Mon 10 February 2025 |
99.18 (0.37%) |
98.85 |
98.76 - 99.18 |
2.1549 times |
Tue 04 February 2025 |
98.81 (-0.22%) |
99.03 |
98.81 - 99.15 |
0.0845 times |
Thu 30 January 2025 |
99.03 (0%) |
99.00 |
98.55 - 99.03 |
0.7606 times |
Mon 10 February 2025 |
(0%) |
|
- |
0 times |

Monthly price and charts GoiTbill Strong monthly Stock price targets for GoiTbill 91D280325_TB are 98.97 and 99.39 | Monthly Target 1 | 98.62 | | Monthly Target 2 | 98.9 | | Monthly Target 3 | 99.04 | | Monthly Target 4 | 99.32 | | Monthly Target 5 | 99.46 |
Monthly price and volumes Goi Tbill
| Date |
Closing |
Open |
Range |
Volume |
Mon 10 February 2025 |
99.18 (0.15%) |
99.03 |
98.76 - 99.18 |
1.2619 times |
Thu 30 January 2025 |
99.03 (0%) |
98.83 |
98.55 - 99.10 |
0.7381 times |
Mon 10 February 2025 |
(0%) |
|
- |
0 times |

DMA SMA EMA moving averages of Goi Tbill 91D280325_TB
DMA (daily moving average) of Goi Tbill 91D280325_TB
| DMA period | DMA value | | 5 day DMA | 99.03 | | 12 day DMA | | | 20 day DMA | | | 35 day DMA | | | 50 day DMA | | | 100 day DMA | | | 150 day DMA | | | 200 day DMA | | EMA (exponential moving average) of Goi Tbill 91D280325_TB
| EMA period | EMA current | EMA prev | EMA prev2 | | 5 day EMA | 99.03 | 98.95 | 99.02 | | 12 day EMA | 0 | 0 | 0 | | 20 day EMA | 0 | 0 | 0 | | 35 day EMA | 0 | 0 | 0 | | 50 day EMA | 0 | 0 | 0 |
SMA (simple moving average) of Goi Tbill 91D280325_TB
| SMA period | SMA current | SMA prev | SMA prev2 | | 5 day SMA | 99.03 | 98.96 | 98.99 | | 12 day SMA | | 20 day SMA | | 35 day SMA | | 50 day SMA | | 100 day SMA | | 150 day SMA | | 200 day SMA |
|
|
