GoiTbill 91D181225_TB full analysis,charts,indicators,moving averages,SMA,DMA,EMA,ADX,MACD,RSIGoi Tbill 91D181225_TB WideScreen charts, DMA,SMA,EMA technical analysis, forecast prediction, by indicators ADX,MACD,RSI,CCI NSE stock exchange
Daily price and charts and targets GoiTbill Strong Daily Stock price targets for GoiTbill 91D181225_TB are 99.48 and 99.56 | Daily Target 1 | 99.47 | | Daily Target 2 | 99.49 | | Daily Target 3 | 99.546666666667 | | Daily Target 4 | 99.57 | | Daily Target 5 | 99.63 |
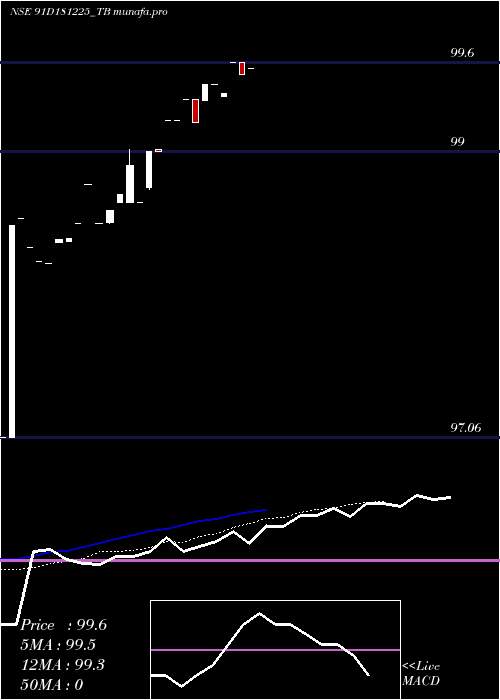
Daily price and volume Goi Tbill
| Date |
Closing |
Open |
Range |
Volume |
Wed 26 November 2025 |
99.52 (-0.08%) |
99.60 |
99.52 - 99.60 |
1.3333 times |
Tue 25 November 2025 |
99.60 (0.21%) |
99.60 |
99.60 - 99.60 |
0.2222 times |
Thu 20 November 2025 |
99.39 (-0.06%) |
99.37 |
99.37 - 99.39 |
0.8889 times |
Wed 19 November 2025 |
99.45 (0%) |
99.45 |
99.45 - 99.45 |
2.4444 times |
Mon 17 November 2025 |
99.45 (0.25%) |
99.34 |
99.34 - 99.45 |
0.4444 times |
Tue 11 November 2025 |
99.20 (-0.15%) |
99.35 |
99.20 - 99.35 |
1.1111 times |
Mon 10 November 2025 |
99.35 (0.14%) |
99.35 |
99.35 - 99.35 |
0.2222 times |
Thu 06 November 2025 |
99.21 (0%) |
99.21 |
99.21 - 99.21 |
0.2222 times |
Fri 24 October 2025 |
99.21 (0.21%) |
99.21 |
99.21 - 99.21 |
2.2222 times |
Thu 23 October 2025 |
99.00 (0%) |
99.01 |
99.00 - 99.01 |
0.8889 times |
Mon 20 October 2025 |
99.00 (0.35%) |
98.75 |
98.74 - 99.00 |
1.5556 times |
Weekly price and charts GoiTbill Strong weekly Stock price targets for GoiTbill 91D181225_TB are 99.48 and 99.56 | Weekly Target 1 | 99.47 | | Weekly Target 2 | 99.49 | | Weekly Target 3 | 99.546666666667 | | Weekly Target 4 | 99.57 | | Weekly Target 5 | 99.63 |
Weekly price and volumes for Goi Tbill
| Date |
Closing |
Open |
Range |
Volume |
Wed 26 November 2025 |
99.52 (0.13%) |
99.60 |
99.52 - 99.60 |
0.2052 times |
Thu 20 November 2025 |
99.39 (0.19%) |
99.34 |
99.34 - 99.45 |
0.4984 times |
Tue 11 November 2025 |
99.20 (-0.01%) |
99.35 |
99.20 - 99.35 |
0.1759 times |
Thu 06 November 2025 |
99.21 (0%) |
99.21 |
99.21 - 99.21 |
0.0293 times |
Fri 24 October 2025 |
99.21 (0.57%) |
98.75 |
98.74 - 99.21 |
0.6156 times |
Wed 15 October 2025 |
98.65 (0.05%) |
98.65 |
98.65 - 99.01 |
1.3192 times |
Fri 10 October 2025 |
98.60 (0.19%) |
98.51 |
98.51 - 98.77 |
4.1042 times |
Wed 01 October 2025 |
98.41 (0.17%) |
98.38 |
98.38 - 98.41 |
1.3779 times |
Fri 26 September 2025 |
98.24 (0%) |
97.06 |
97.06 - 98.55 |
0.6743 times |
Thu 27 November 2025 |
(0%) |
|
- |
0 times |

Monthly price and charts GoiTbill Strong monthly Stock price targets for GoiTbill 91D181225_TB are 99.36 and 99.76 | Monthly Target 1 | 99.04 | | Monthly Target 2 | 99.28 | | Monthly Target 3 | 99.44 | | Monthly Target 4 | 99.68 | | Monthly Target 5 | 99.84 |
Monthly price and volumes Goi Tbill
| Date |
Closing |
Open |
Range |
Volume |
Wed 26 November 2025 |
99.52 (0.31%) |
99.21 |
99.20 - 99.60 |
0.3019 times |
Fri 24 October 2025 |
99.21 (0.82%) |
98.39 |
98.39 - 99.21 |
2.0357 times |
Mon 29 September 2025 |
98.40 (0%) |
97.06 |
97.06 - 98.55 |
0.6623 times |
Thu 27 November 2025 |
(0%) |
|
- |
0 times |

DMA SMA EMA moving averages of Goi Tbill 91D181225_TB
DMA (daily moving average) of Goi Tbill 91D181225_TB
| DMA period | DMA value | | 5 day DMA | 99.48 | | 12 day DMA | 99.25 | | 20 day DMA | 98.99 | | 35 day DMA | | | 50 day DMA | | | 100 day DMA | | | 150 day DMA | | | 200 day DMA | | EMA (exponential moving average) of Goi Tbill 91D181225_TB
| EMA period | EMA current | EMA prev | EMA prev2 | | 5 day EMA | 99.46 | 99.43 | 99.34 | | 12 day EMA | 99.26 | 99.21 | 99.14 | | 20 day EMA | 99 | 98.94 | 98.87 | | 35 day EMA | 0 | 0 | 0 | | 50 day EMA | 0 | 0 | 0 |
SMA (simple moving average) of Goi Tbill 91D181225_TB
| SMA period | SMA current | SMA prev | SMA prev2 | | 5 day SMA | 99.48 | 99.42 | 99.37 | | 12 day SMA | 99.25 | 99.2 | 99.13 | | 20 day SMA | 98.99 | 98.93 | 98.86 | | 35 day SMA | | 50 day SMA | | 100 day SMA | | 150 day SMA | | 200 day SMA |
|
|
