GoiTbill 91D090524_TB full analysis,charts,indicators,moving averages,SMA,DMA,EMA,ADX,MACD,RSIGoi Tbill 91D090524_TB WideScreen charts, DMA,SMA,EMA technical analysis, forecast prediction, by indicators ADX,MACD,RSI,CCI NSE stock exchange
Daily price and charts and targets GoiTbill Strong Daily Stock price targets for GoiTbill 91D090524_TB are 99.88 and 99.93 | Daily Target 1 | 99.83 | | Daily Target 2 | 99.87 | | Daily Target 3 | 99.883333333333 | | Daily Target 4 | 99.92 | | Daily Target 5 | 99.93 |
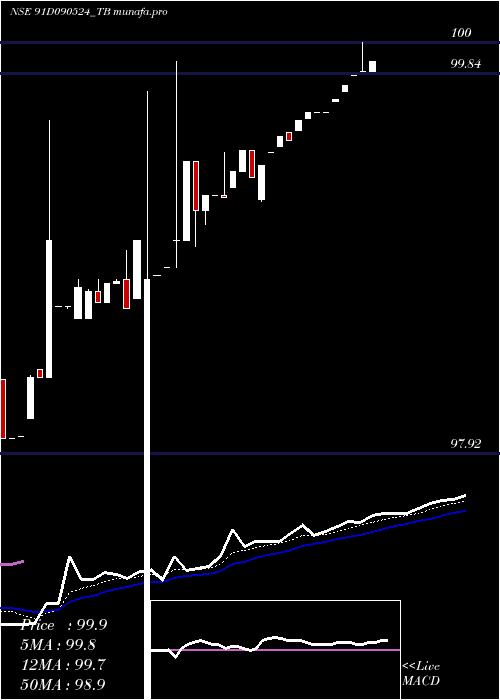
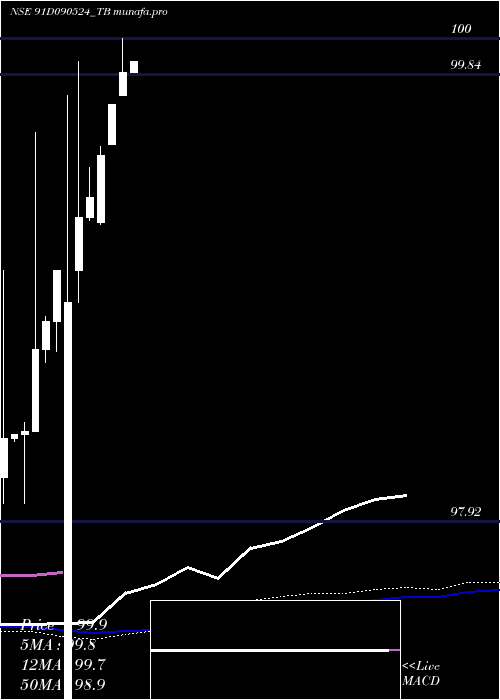
Daily price and volume Goi Tbill
| Date |
Closing |
Open |
Range |
Volume |
Mon 06 May 2024 |
99.90 (0.05%) |
99.85 |
99.85 - 99.90 |
2.9333 times |
Fri 03 May 2024 |
99.85 (0.02%) |
99.85 |
99.85 - 100.00 |
1.7333 times |
Thu 02 May 2024 |
99.83 (0.05%) |
99.83 |
99.83 - 99.83 |
0.1333 times |
Tue 30 April 2024 |
99.78 (0.07%) |
99.75 |
99.75 - 99.78 |
0.4 times |
Fri 26 April 2024 |
99.71 (0.07%) |
99.70 |
99.70 - 99.71 |
1.3333 times |
Thu 25 April 2024 |
99.64 (0%) |
99.64 |
99.64 - 99.64 |
0.4 times |
Wed 24 April 2024 |
99.64 (0%) |
99.64 |
99.64 - 99.64 |
0.2667 times |
Tue 23 April 2024 |
99.64 (0.04%) |
99.61 |
99.61 - 99.64 |
0.5333 times |
Mon 22 April 2024 |
99.60 (0.1%) |
99.55 |
99.55 - 99.60 |
1.6 times |
Fri 19 April 2024 |
99.50 (-0.02%) |
99.54 |
99.50 - 99.54 |
0.6667 times |
Thu 18 April 2024 |
99.52 (0.08%) |
99.47 |
99.47 - 99.52 |
1.3333 times |
Weekly price and charts GoiTbill Strong weekly Stock price targets for GoiTbill 91D090524_TB are 99.88 and 99.93 | Weekly Target 1 | 99.83 | | Weekly Target 2 | 99.87 | | Weekly Target 3 | 99.883333333333 | | Weekly Target 4 | 99.92 | | Weekly Target 5 | 99.93 |
Weekly price and volumes for Goi Tbill
| Date |
Closing |
Open |
Range |
Volume |
Mon 06 May 2024 |
99.90 (0.05%) |
99.85 |
99.85 - 99.90 |
0.4037 times |
Fri 03 May 2024 |
99.85 (0.14%) |
99.75 |
99.75 - 100.00 |
0.3119 times |
Fri 26 April 2024 |
99.71 (0.21%) |
99.55 |
99.55 - 99.71 |
0.5688 times |
Fri 19 April 2024 |
99.50 (0.18%) |
99.21 |
99.20 - 99.54 |
0.6789 times |
Fri 12 April 2024 |
99.32 (0.09%) |
99.23 |
99.22 - 99.45 |
0.4404 times |
Fri 05 April 2024 |
99.23 (0.37%) |
99.00 |
98.86 - 99.90 |
1.4495 times |
Thu 28 March 2024 |
98.86 (-0.14%) |
96.00 |
96.00 - 99.75 |
0.8624 times |
Thu 21 March 2024 |
99.00 (0.22%) |
98.78 |
98.65 - 99.00 |
2.5688 times |
Fri 15 March 2024 |
98.78 (0.12%) |
98.66 |
98.60 - 98.80 |
2.6422 times |
Thu 07 March 2024 |
98.66 (0.36%) |
98.31 |
98.31 - 99.60 |
0.0734 times |
Sat 02 March 2024 |
98.31 (0.01%) |
98.30 |
98.00 - 98.35 |
0.9908 times |
Monthly price and charts GoiTbill Strong monthly Stock price targets for GoiTbill 91D090524_TB are 99.87 and 100.04 | Monthly Target 1 | 99.74 | | Monthly Target 2 | 99.82 | | Monthly Target 3 | 99.91 | | Monthly Target 4 | 99.99 | | Monthly Target 5 | 100.08 |
Monthly price and volumes Goi Tbill
| Date |
Closing |
Open |
Range |
Volume |
Mon 06 May 2024 |
99.90 (0.12%) |
99.83 |
99.83 - 100.00 |
0.1949 times |
Tue 30 April 2024 |
99.78 (0.93%) |
99.00 |
98.86 - 99.90 |
0.9418 times |
Thu 28 March 2024 |
98.86 (0.87%) |
98.10 |
96.00 - 99.75 |
2.0352 times |
Thu 29 February 2024 |
98.01 (0%) |
99.00 |
98.00 - 99.00 |
0.8281 times |
Sat 18 May 2024 |
(0%) |
|
- |
0 times |

DMA SMA EMA moving averages of Goi Tbill 91D090524_TB
DMA (daily moving average) of Goi Tbill 91D090524_TB
| DMA period | DMA value | | 5 day DMA | 99.81 | | 12 day DMA | 99.67 | | 20 day DMA | 99.52 | | 35 day DMA | 99.23 | | 50 day DMA | | | 100 day DMA | | | 150 day DMA | | | 200 day DMA | | EMA (exponential moving average) of Goi Tbill 91D090524_TB
| EMA period | EMA current | EMA prev | EMA prev2 | | 5 day EMA | 99.82 | 99.78 | 99.74 | | 12 day EMA | 99.67 | 99.63 | 99.59 | | 20 day EMA | 99.51 | 99.47 | 99.43 | | 35 day EMA | 99.25 | 99.21 | 99.17 | | 50 day EMA | 98.93 | 98.89 |
SMA (simple moving average) of Goi Tbill 91D090524_TB
| SMA period | SMA current | SMA prev | SMA prev2 | | 5 day SMA | 99.81 | 99.76 | 99.72 | | 12 day SMA | 99.67 | 99.63 | 99.58 | | 20 day SMA | 99.52 | 99.49 | 99.45 | | 35 day SMA | 99.23 | 99.18 | 99.14 | | 50 day SMA | | 100 day SMA | | 150 day SMA | | 200 day SMA |
|
|
