GoiTbill 91D090125_TB full analysis,charts,indicators,moving averages,SMA,DMA,EMA,ADX,MACD,RSIGoi Tbill 91D090125_TB WideScreen charts, DMA,SMA,EMA technical analysis, forecast prediction, by indicators ADX,MACD,RSI,CCI NSE stock exchange
Daily price and charts and targets GoiTbill Strong Daily Stock price targets for GoiTbill 91D090125_TB are 99.35 and 99.35 | Daily Target 1 | 99.35 | | Daily Target 2 | 99.35 | | Daily Target 3 | 99.35 | | Daily Target 4 | 99.35 | | Daily Target 5 | 99.35 |
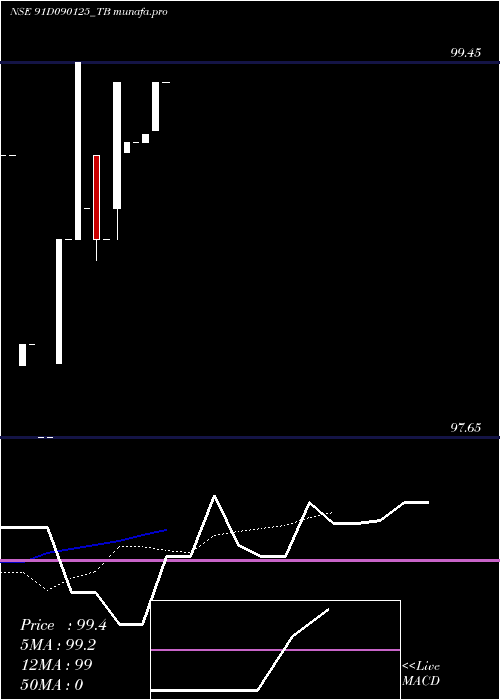
Daily price and volume Goi Tbill
| Date |
Closing |
Open |
Range |
Volume |
Tue 24 December 2024 |
99.35 (0%) |
99.35 |
99.35 - 99.35 |
1.3889 times |
Wed 11 December 2024 |
99.35 (0.25%) |
99.12 |
99.12 - 99.35 |
0.8333 times |
Tue 10 December 2024 |
99.10 (0.04%) |
99.06 |
99.06 - 99.10 |
0.6944 times |
Mon 09 December 2024 |
99.06 (0%) |
99.06 |
99.06 - 99.06 |
0.1389 times |
Wed 04 December 2024 |
99.06 (-0.29%) |
99.01 |
99.01 - 99.06 |
0.2778 times |
Tue 03 December 2024 |
99.35 (0.76%) |
98.75 |
98.60 - 99.35 |
4.4444 times |
Mon 02 December 2024 |
98.60 (0%) |
98.60 |
98.60 - 98.60 |
0.5556 times |
Thu 21 November 2024 |
98.60 (-0.15%) |
99.00 |
98.50 - 99.00 |
0.9722 times |
Tue 19 November 2024 |
98.75 (-0.7%) |
98.75 |
98.75 - 98.75 |
0.4167 times |
Thu 14 November 2024 |
99.45 (0.86%) |
98.60 |
98.60 - 99.45 |
0.2778 times |
Wed 13 November 2024 |
98.60 (0%) |
98.60 |
98.60 - 98.60 |
0.2778 times |
Weekly price and charts GoiTbill Strong weekly Stock price targets for GoiTbill 91D090125_TB are 99.35 and 99.35 | Weekly Target 1 | 99.35 | | Weekly Target 2 | 99.35 | | Weekly Target 3 | 99.35 | | Weekly Target 4 | 99.35 | | Weekly Target 5 | 99.35 |
Weekly price and volumes for Goi Tbill
| Date |
Closing |
Open |
Range |
Volume |
Tue 24 December 2024 |
99.35 (0%) |
99.35 |
99.35 - 99.35 |
0.7527 times |
Wed 11 December 2024 |
99.35 (0.29%) |
99.06 |
99.06 - 99.35 |
0.9032 times |
Wed 04 December 2024 |
99.06 (0.47%) |
98.60 |
98.60 - 99.35 |
2.8602 times |
Thu 21 November 2024 |
98.60 (-0.85%) |
98.75 |
98.50 - 99.00 |
0.7527 times |
Thu 14 November 2024 |
99.45 (1.84%) |
97.65 |
97.65 - 99.45 |
0.5269 times |
Mon 04 November 2024 |
97.65 (-0.46%) |
97.65 |
97.65 - 97.65 |
0.0753 times |
Thu 31 October 2024 |
98.10 (0%) |
99.00 |
98.00 - 99.00 |
1.129 times |
Fri 31 January 2025 |
(0%) |
|
- |
0 times |

Monthly price and charts GoiTbill Strong monthly Stock price targets for GoiTbill 91D090125_TB are 98.98 and 99.73 | Monthly Target 1 | 98.35 | | Monthly Target 2 | 98.85 | | Monthly Target 3 | 99.1 | | Monthly Target 4 | 99.6 | | Monthly Target 5 | 99.85 |
Monthly price and volumes Goi Tbill
| Date |
Closing |
Open |
Range |
Volume |
Tue 24 December 2024 |
99.35 (0.76%) |
98.60 |
98.60 - 99.35 |
1.9355 times |
Thu 21 November 2024 |
98.60 (0.51%) |
97.65 |
97.65 - 99.45 |
0.5806 times |
Thu 31 October 2024 |
98.10 (0%) |
99.00 |
98.00 - 99.00 |
0.4839 times |
Fri 31 January 2025 |
(0%) |
|
- |
0 times |

DMA SMA EMA moving averages of Goi Tbill 91D090125_TB
DMA (daily moving average) of Goi Tbill 91D090125_TB
| DMA period | DMA value | | 5 day DMA | 99.18 | | 12 day DMA | 98.99 | | 20 day DMA | | | 35 day DMA | | | 50 day DMA | | | 100 day DMA | | | 150 day DMA | | | 200 day DMA | | EMA (exponential moving average) of Goi Tbill 91D090125_TB
| EMA period | EMA current | EMA prev | EMA prev2 | | 5 day EMA | 99.21 | 99.14 | 99.03 | | 12 day EMA | 98.96 | 98.89 | 98.81 | | 20 day EMA | 0 | 0 | 0 | | 35 day EMA | 0 | 0 | 0 | | 50 day EMA | 0 | 0 | 0 |
SMA (simple moving average) of Goi Tbill 91D090125_TB
| SMA period | SMA current | SMA prev | SMA prev2 | | 5 day SMA | 99.18 | 99.18 | 99.03 | | 12 day SMA | 98.99 | 98.85 | 98.71 | | 20 day SMA | | 35 day SMA | | 50 day SMA | | 100 day SMA | | 150 day SMA | | 200 day SMA |
|
|
