GoiTbill 91D040925_TB full analysis,charts,indicators,moving averages,SMA,DMA,EMA,ADX,MACD,RSIGoi Tbill 91D040925_TB WideScreen charts, DMA,SMA,EMA technical analysis, forecast prediction, by indicators ADX,MACD,RSI,CCI NSE stock exchange
Daily price and charts and targets GoiTbill Strong Daily Stock price targets for GoiTbill 91D040925_TB are 99.15 and 99.15 | Daily Target 1 | 99.15 | | Daily Target 2 | 99.15 | | Daily Target 3 | 99.15 | | Daily Target 4 | 99.15 | | Daily Target 5 | 99.15 |
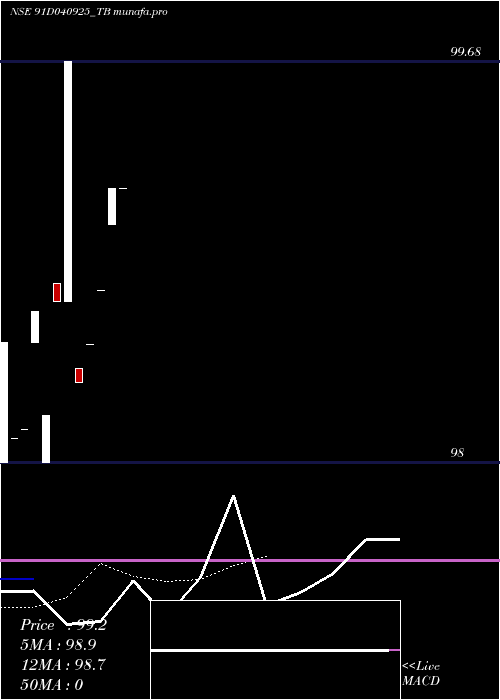
Daily price and volume Goi Tbill
| Date |
Closing |
Open |
Range |
Volume |
Fri 11 July 2025 |
99.15 (0%) |
99.15 |
99.15 - 99.15 |
0.32 times |
Thu 10 July 2025 |
99.15 (0.44%) |
99.00 |
99.00 - 99.15 |
0.32 times |
Wed 09 July 2025 |
98.72 (0.23%) |
98.72 |
98.72 - 98.72 |
3.52 times |
Mon 30 June 2025 |
98.49 (0.15%) |
98.49 |
98.49 - 98.49 |
0.88 times |
Tue 24 June 2025 |
98.34 (-1.34%) |
98.40 |
98.34 - 98.40 |
0.16 times |
Wed 18 June 2025 |
99.68 (1.02%) |
98.67 |
98.67 - 99.68 |
2.4 times |
Tue 17 June 2025 |
98.67 (0.48%) |
98.75 |
98.67 - 98.75 |
0.8 times |
Mon 16 June 2025 |
98.20 (-0.44%) |
98.00 |
98.00 - 98.20 |
0.8 times |
Fri 13 June 2025 |
98.63 (0.5%) |
98.50 |
98.50 - 98.63 |
0.72 times |
Thu 12 June 2025 |
98.14 (0.04%) |
98.14 |
98.14 - 98.14 |
0.08 times |
Wed 11 June 2025 |
98.10 (-0.41%) |
98.10 |
98.10 - 98.10 |
0.08 times |
Weekly price and charts GoiTbill Strong weekly Stock price targets for GoiTbill 91D040925_TB are 98.82 and 99.48 | Weekly Target 1 | 98.27 | | Weekly Target 2 | 98.71 | | Weekly Target 3 | 98.93 | | Weekly Target 4 | 99.37 | | Weekly Target 5 | 99.59 |
Weekly price and volumes for Goi Tbill
| Date |
Closing |
Open |
Range |
Volume |
Fri 11 July 2025 |
99.15 (0.82%) |
98.49 |
98.49 - 99.15 |
1.6435 times |
Tue 24 June 2025 |
98.34 (-1.34%) |
98.40 |
98.34 - 98.40 |
0.0522 times |
Wed 18 June 2025 |
99.68 (0%) |
98.00 |
98.00 - 99.68 |
1.3043 times |
Sat 12 July 2025 |
(0%) |
|
- |
0 times |

Monthly price and charts GoiTbill Strong monthly Stock price targets for GoiTbill 91D040925_TB are 98.94 and 99.37 | Monthly Target 1 | 98.58 | | Monthly Target 2 | 98.86 | | Monthly Target 3 | 99.006666666667 | | Monthly Target 4 | 99.29 | | Monthly Target 5 | 99.44 |
Monthly price and volumes Goi Tbill
| Date |
Closing |
Open |
Range |
Volume |
Fri 11 July 2025 |
99.15 (0.67%) |
98.72 |
98.72 - 99.15 |
0.7647 times |
Mon 30 June 2025 |
98.49 (0%) |
98.00 |
98.00 - 99.68 |
1.2353 times |
Sat 12 July 2025 |
(0%) |
|
- |
0 times |

DMA SMA EMA moving averages of Goi Tbill 91D040925_TB
DMA (daily moving average) of Goi Tbill 91D040925_TB
| DMA period | DMA value | | 5 day DMA | 98.77 | | 12 day DMA | | | 20 day DMA | | | 35 day DMA | | | 50 day DMA | | | 100 day DMA | | | 150 day DMA | | | 200 day DMA | | EMA (exponential moving average) of Goi Tbill 91D040925_TB
| EMA period | EMA current | EMA prev | EMA prev2 | | 5 day EMA | 98.93 | 98.82 | 98.65 | | 12 day EMA | 98.65 | | 20 day EMA | 0 | 0 | 0 | | 35 day EMA | 0 | 0 | 0 | | 50 day EMA | 0 | 0 | 0 |
SMA (simple moving average) of Goi Tbill 91D040925_TB
| SMA period | SMA current | SMA prev | SMA prev2 | | 5 day SMA | 98.77 | 98.88 | 98.78 | | 12 day SMA | | 20 day SMA | | 35 day SMA | | 50 day SMA | | 100 day SMA | | 150 day SMA | | 200 day SMA |
|
|
