GoiTbill 91D021025_TB full analysis,charts,indicators,moving averages,SMA,DMA,EMA,ADX,MACD,RSIGoi Tbill 91D021025_TB WideScreen charts, DMA,SMA,EMA technical analysis, forecast prediction, by indicators ADX,MACD,RSI,CCI NSE stock exchange
Daily price and charts and targets GoiTbill Strong Daily Stock price targets for GoiTbill 91D021025_TB are 99.74 and 99.74 | Daily Target 1 | 99.74 | | Daily Target 2 | 99.74 | | Daily Target 3 | 99.74 | | Daily Target 4 | 99.74 | | Daily Target 5 | 99.74 |
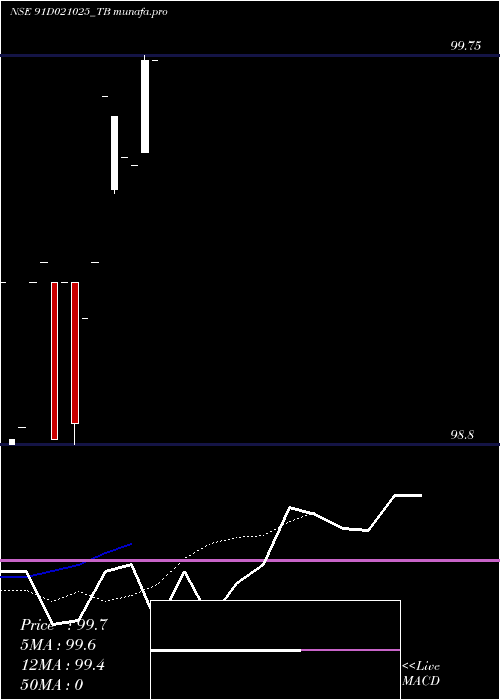
Daily price and volume Goi Tbill
| Date |
Closing |
Open |
Range |
Volume |
Thu 18 September 2025 |
99.74 (0%) |
99.74 |
99.74 - 99.74 |
0.1923 times |
Wed 17 September 2025 |
99.74 (0.26%) |
99.51 |
99.51 - 99.75 |
4.2308 times |
Thu 11 September 2025 |
99.48 (-0.02%) |
99.48 |
99.48 - 99.48 |
0.1923 times |
Wed 10 September 2025 |
99.50 (-0.1%) |
99.50 |
99.50 - 99.50 |
0.9615 times |
Tue 09 September 2025 |
99.60 (-0.05%) |
99.42 |
99.41 - 99.60 |
0.5769 times |
Mon 08 September 2025 |
99.65 (0.4%) |
99.65 |
99.65 - 99.65 |
0.1923 times |
Tue 26 August 2025 |
99.25 (0.14%) |
99.25 |
99.25 - 99.25 |
0.9615 times |
Thu 21 August 2025 |
99.11 (0.26%) |
99.11 |
99.11 - 99.11 |
0.1923 times |
Wed 13 August 2025 |
98.85 (-0.35%) |
99.20 |
98.80 - 99.20 |
2.3077 times |
Tue 12 August 2025 |
99.20 (0.39%) |
99.20 |
99.20 - 99.20 |
0.1923 times |
Mon 11 August 2025 |
98.81 (-0.44%) |
99.20 |
98.81 - 99.20 |
1.1538 times |
Weekly price and charts GoiTbill Strong weekly Stock price targets for GoiTbill 91D021025_TB are 99.63 and 99.87 | Weekly Target 1 | 99.43 | | Weekly Target 2 | 99.58 | | Weekly Target 3 | 99.666666666667 | | Weekly Target 4 | 99.82 | | Weekly Target 5 | 99.91 |
Weekly price and volumes for Goi Tbill
| Date |
Closing |
Open |
Range |
Volume |
Thu 18 September 2025 |
99.74 (0.26%) |
99.51 |
99.51 - 99.75 |
1.3529 times |
Thu 11 September 2025 |
99.48 (0.23%) |
99.65 |
99.41 - 99.65 |
0.5882 times |
Tue 26 August 2025 |
99.25 (0.14%) |
99.25 |
99.25 - 99.25 |
0.2941 times |
Thu 21 August 2025 |
99.11 (-0.14%) |
99.20 |
98.80 - 99.20 |
1.1765 times |
Fri 08 August 2025 |
99.25 (0%) |
99.20 |
98.80 - 99.25 |
1.5882 times |
Fri 19 September 2025 |
(0%) |
|
- |
0 times |

Monthly price and charts GoiTbill Strong monthly Stock price targets for GoiTbill 91D021025_TB are 99.58 and 99.92 | Monthly Target 1 | 99.29 | | Monthly Target 2 | 99.52 | | Monthly Target 3 | 99.633333333333 | | Monthly Target 4 | 99.86 | | Monthly Target 5 | 99.97 |
Monthly price and volumes Goi Tbill
| Date |
Closing |
Open |
Range |
Volume |
Thu 18 September 2025 |
99.74 (0.49%) |
99.65 |
99.41 - 99.75 |
0.7765 times |
Tue 26 August 2025 |
99.25 (0%) |
99.20 |
98.80 - 99.25 |
1.2235 times |
Fri 19 September 2025 |
(0%) |
|
- |
0 times |

DMA SMA EMA moving averages of Goi Tbill 91D021025_TB
DMA (daily moving average) of Goi Tbill 91D021025_TB
| DMA period | DMA value | | 5 day DMA | 99.61 | | 12 day DMA | 99.35 | | 20 day DMA | | | 35 day DMA | | | 50 day DMA | | | 100 day DMA | | | 150 day DMA | | | 200 day DMA | | EMA (exponential moving average) of Goi Tbill 91D021025_TB
| EMA period | EMA current | EMA prev | EMA prev2 | | 5 day EMA | 99.61 | 99.55 | 99.45 | | 12 day EMA | 99.38 | 99.32 | 99.24 | | 20 day EMA | 0 | 0 | 0 | | 35 day EMA | 0 | 0 | 0 | | 50 day EMA | 0 | 0 | 0 |
SMA (simple moving average) of Goi Tbill 91D021025_TB
| SMA period | SMA current | SMA prev | SMA prev2 | | 5 day SMA | 99.61 | 99.59 | 99.5 | | 12 day SMA | 99.35 | 99.3 | 99.23 | | 20 day SMA | | 35 day SMA | | 50 day SMA | | 100 day SMA | | 150 day SMA | | 200 day SMA |
|
|
