GoiTbill 91D020126_TB full analysis,charts,indicators,moving averages,SMA,DMA,EMA,ADX,MACD,RSIGoi Tbill 91D020126_TB WideScreen charts, DMA,SMA,EMA technical analysis, forecast prediction, by indicators ADX,MACD,RSI,CCI NSE stock exchange
Daily price and charts and targets GoiTbill Strong Daily Stock price targets for GoiTbill 91D020126_TB are 98.97 and 98.99 | Daily Target 1 | 98.95 | | Daily Target 2 | 98.97 | | Daily Target 3 | 98.973333333333 | | Daily Target 4 | 98.99 | | Daily Target 5 | 98.99 |
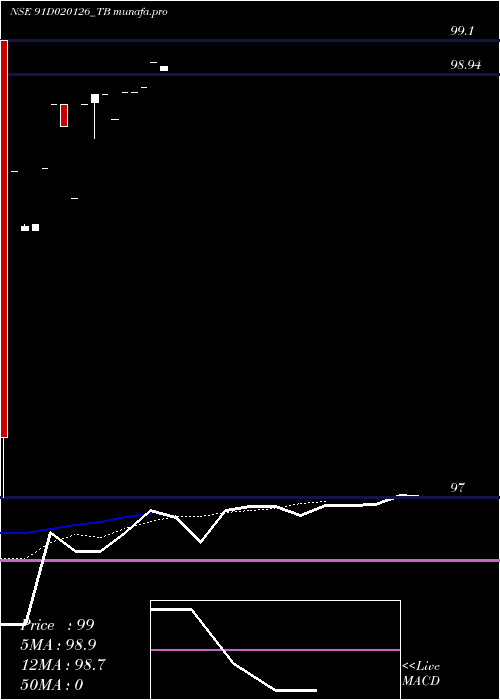
Daily price and volume Goi Tbill
| Date |
Closing |
Open |
Range |
Volume |
Fri 14 November 2025 |
98.98 (-0.02%) |
98.96 |
98.96 - 98.98 |
2 times |
Thu 13 November 2025 |
99.00 (0.12%) |
99.00 |
99.00 - 99.00 |
0.6667 times |
Mon 10 November 2025 |
98.88 (0.02%) |
98.88 |
98.88 - 98.88 |
0.2222 times |
Thu 06 November 2025 |
98.86 (0%) |
98.86 |
98.86 - 98.86 |
0.4444 times |
Tue 04 November 2025 |
98.86 (0.13%) |
98.86 |
98.86 - 98.86 |
0.2222 times |
Mon 03 November 2025 |
98.73 (-0.12%) |
98.73 |
98.73 - 98.73 |
2.4444 times |
Thu 30 October 2025 |
98.85 (0%) |
98.85 |
98.85 - 98.85 |
0.2222 times |
Wed 29 October 2025 |
98.85 (0.05%) |
98.81 |
98.65 - 98.85 |
2.8889 times |
Tue 28 October 2025 |
98.80 (0.44%) |
98.80 |
98.80 - 98.80 |
0.6667 times |
Thu 16 October 2025 |
98.37 (-0.33%) |
98.37 |
98.37 - 98.37 |
0.2222 times |
Wed 15 October 2025 |
98.70 (-0.1%) |
98.80 |
98.70 - 98.80 |
1.1111 times |
Weekly price and charts GoiTbill Strong weekly Stock price targets for GoiTbill 91D020126_TB are 98.93 and 99.05 | Weekly Target 1 | 98.83 | | Weekly Target 2 | 98.91 | | Weekly Target 3 | 98.953333333333 | | Weekly Target 4 | 99.03 | | Weekly Target 5 | 99.07 |
Weekly price and volumes for Goi Tbill
| Date |
Closing |
Open |
Range |
Volume |
Fri 14 November 2025 |
98.98 (0.12%) |
98.88 |
98.88 - 99.00 |
0.6566 times |
Thu 06 November 2025 |
98.86 (0.01%) |
98.73 |
98.73 - 98.86 |
0.7071 times |
Thu 30 October 2025 |
98.85 (0.49%) |
98.80 |
98.65 - 98.85 |
0.8586 times |
Thu 16 October 2025 |
98.37 (0.12%) |
98.51 |
98.37 - 98.80 |
0.404 times |
Fri 10 October 2025 |
98.25 (0%) |
99.10 |
97.00 - 99.10 |
2.3737 times |
Mon 17 November 2025 |
(0%) |
|
- |
0 times |

Monthly price and charts GoiTbill Strong monthly Stock price targets for GoiTbill 91D020126_TB are 98.86 and 99.13 | Monthly Target 1 | 98.63 | | Monthly Target 2 | 98.81 | | Monthly Target 3 | 98.903333333333 | | Monthly Target 4 | 99.08 | | Monthly Target 5 | 99.17 |
Monthly price and volumes Goi Tbill
| Date |
Closing |
Open |
Range |
Volume |
Fri 14 November 2025 |
98.98 (0.13%) |
98.73 |
98.73 - 99.00 |
0.5455 times |
Thu 30 October 2025 |
98.85 (0%) |
99.10 |
97.00 - 99.10 |
1.4545 times |
Mon 17 November 2025 |
(0%) |
|
- |
0 times |

DMA SMA EMA moving averages of Goi Tbill 91D020126_TB
DMA (daily moving average) of Goi Tbill 91D020126_TB
| DMA period | DMA value | | 5 day DMA | 98.92 | | 12 day DMA | 98.81 | | 20 day DMA | | | 35 day DMA | | | 50 day DMA | | | 100 day DMA | | | 150 day DMA | | | 200 day DMA | | EMA (exponential moving average) of Goi Tbill 91D020126_TB
| EMA period | EMA current | EMA prev | EMA prev2 | | 5 day EMA | 98.92 | 98.89 | 98.83 | | 12 day EMA | 98.74 | 98.7 | 98.64 | | 20 day EMA | 0 | 0 | 0 | | 35 day EMA | 0 | 0 | 0 | | 50 day EMA | 0 | 0 | 0 |
SMA (simple moving average) of Goi Tbill 91D020126_TB
| SMA period | SMA current | SMA prev | SMA prev2 | | 5 day SMA | 98.92 | 98.87 | 98.84 | | 12 day SMA | 98.81 | 98.77 | 98.71 | | 20 day SMA | | 35 day SMA | | 50 day SMA | | 100 day SMA | | 150 day SMA | | 200 day SMA |
|
|
