TaxFree 729IRFC26_NN full analysis,charts,indicators,moving averages,SMA,DMA,EMA,ADX,MACD,RSITax Free 729IRFC26_NN WideScreen charts, DMA,SMA,EMA technical analysis, forecast prediction, by indicators ADX,MACD,RSI,CCI NSE stock exchange
Daily price and charts and targets TaxFree Strong Daily Stock price targets for TaxFree 729IRFC26_NN are 1027.99 and 1027.99 | Daily Target 1 | 1027.99 | | Daily Target 2 | 1027.99 | | Daily Target 3 | 1027.99 | | Daily Target 4 | 1027.99 | | Daily Target 5 | 1027.99 |
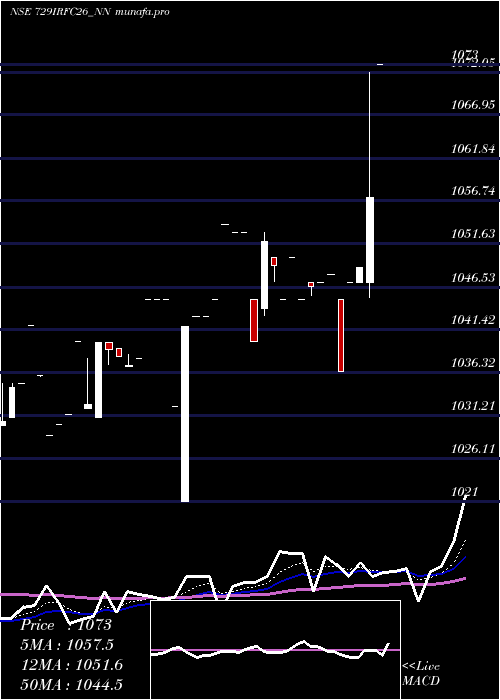
Daily price and volume Tax Free
| Date |
Closing |
Open |
Range |
Volume |
Fri 19 December 2025 |
1027.99 (0.78%) |
1027.99 |
1027.99 - 1027.99 |
0.4092 times |
Thu 18 December 2025 |
1020.00 (0%) |
1027.99 |
1020.00 - 1027.99 |
0.491 times |
Tue 16 December 2025 |
1020.00 (0%) |
1020.00 |
1020.00 - 1020.00 |
1.3584 times |
Mon 15 December 2025 |
1020.00 (0.88%) |
1020.00 |
1020.00 - 1020.00 |
1.9149 times |
Thu 11 December 2025 |
1011.15 (-1.83%) |
1030.00 |
1011.11 - 1030.00 |
1.6203 times |
Tue 02 December 2025 |
1030.00 (0%) |
1030.00 |
1030.00 - 1030.00 |
0.0164 times |
Wed 19 November 2025 |
1029.99 (-0.48%) |
1029.99 |
1029.99 - 1029.99 |
0.6547 times |
Tue 18 November 2025 |
1035.00 (1.87%) |
1049.00 |
1035.00 - 1049.00 |
2.8805 times |
Wed 12 November 2025 |
1016.00 (0%) |
1016.00 |
1016.00 - 1016.00 |
0.3273 times |
Tue 11 November 2025 |
1016.00 (-1.26%) |
1016.00 |
1016.00 - 1016.00 |
0.3273 times |
Mon 10 November 2025 |
1028.99 (2.18%) |
1049.00 |
1005.31 - 1049.00 |
0.5237 times |
Weekly price and charts TaxFree Strong weekly Stock price targets for TaxFree 729IRFC26_NN are 1024 and 1031.99 | Weekly Target 1 | 1017.34 | | Weekly Target 2 | 1022.66 | | Weekly Target 3 | 1025.3266666667 | | Weekly Target 4 | 1030.65 | | Weekly Target 5 | 1033.32 |
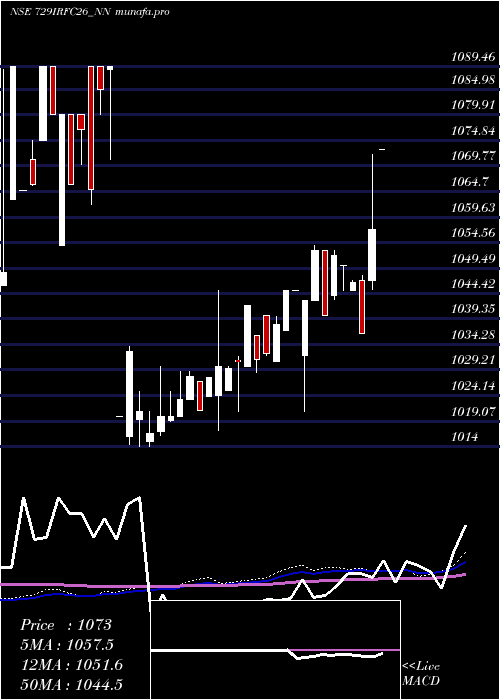
Weekly price and volumes for Tax Free
| Date |
Closing |
Open |
Range |
Volume |
Fri 19 December 2025 |
1027.99 (1.67%) |
1020.00 |
1020.00 - 1027.99 |
0.6498 times |
Thu 11 December 2025 |
1011.15 (-1.83%) |
1030.00 |
1011.11 - 1030.00 |
0.2548 times |
Wed 19 November 2025 |
1029.99 (1.38%) |
1049.00 |
1029.99 - 1049.00 |
0.5505 times |
Wed 12 November 2025 |
1016.00 (0.89%) |
1049.00 |
1005.31 - 1049.00 |
0.1835 times |
Fri 31 October 2025 |
1007.00 (-2.23%) |
1030.00 |
1007.00 - 1030.00 |
0.1784 times |
Thu 23 October 2025 |
1029.99 (0.98%) |
1018.00 |
1004.80 - 1029.99 |
0.0586 times |
Fri 17 October 2025 |
1020.00 (1.47%) |
980.09 |
980.09 - 1020.00 |
2.9103 times |
Fri 10 October 2025 |
1005.23 (0.02%) |
1006.00 |
1001.21 - 1028.79 |
1.5928 times |
Wed 01 October 2025 |
1005.00 (-4.29%) |
1050.10 |
1005.00 - 1050.10 |
2.1916 times |
Fri 26 September 2025 |
1050.10 (-0.46%) |
1068.10 |
1050.10 - 1068.10 |
1.4297 times |
Thu 18 September 2025 |
1055.00 (-1.86%) |
1055.00 |
1055.00 - 1055.00 |
0.0025 times |
Monthly price and charts TaxFree Strong monthly Stock price targets for TaxFree 729IRFC26_NN are 1010.11 and 1029 | Monthly Target 1 | 1004.14 | | Monthly Target 2 | 1016.07 | | Monthly Target 3 | 1023.0333333333 | | Monthly Target 4 | 1034.96 | | Monthly Target 5 | 1041.92 |
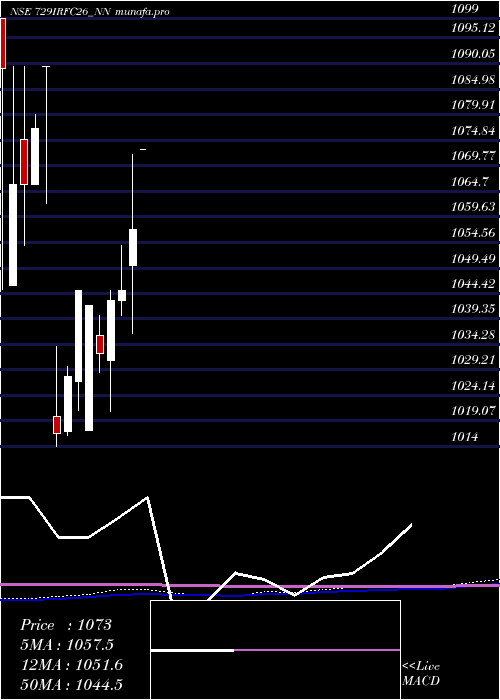
Monthly price and volumes Tax Free
| Date |
Closing |
Open |
Range |
Volume |
Fri 19 December 2025 |
1027.99 (-0.19%) |
1030.00 |
1011.11 - 1030.00 |
0.1519 times |
Wed 19 November 2025 |
1029.99 (2.28%) |
1049.00 |
1005.31 - 1049.00 |
0.1232 times |
Fri 31 October 2025 |
1007.00 (-0.79%) |
1009.40 |
980.09 - 1030.00 |
1.1381 times |
Tue 30 September 2025 |
1015.00 (-4.43%) |
1061.00 |
1015.00 - 1075.00 |
0.9143 times |
Fri 29 August 2025 |
1062.00 (0.76%) |
1054.01 |
1041.10 - 1079.50 |
0.8211 times |
Thu 31 July 2025 |
1054.01 (-0.8%) |
1055.00 |
1041.10 - 1079.90 |
3.09 times |
Mon 30 June 2025 |
1062.50 (0.51%) |
1073.00 |
1038.00 - 1073.00 |
1.6002 times |
Fri 23 May 2025 |
1057.12 (1.16%) |
1050.00 |
1036.41 - 1071.99 |
0.6555 times |
Wed 30 April 2025 |
1045.00 (0.19%) |
1043.00 |
1040.00 - 1054.00 |
0.7115 times |
Wed 26 March 2025 |
1043.00 (1.02%) |
1030.98 |
1021.00 - 1044.99 |
0.7941 times |
Fri 28 February 2025 |
1032.49 (-0.91%) |
1036.00 |
1028.80 - 1039.99 |
0.3906 times |
DMA SMA EMA moving averages of Tax Free 729IRFC26_NN
DMA (daily moving average) of Tax Free 729IRFC26_NN
| DMA period | DMA value | | 5 day DMA | 1019.83 | | 12 day DMA | 1021.84 | | 20 day DMA | 1019.45 | | 35 day DMA | 1030.42 | | 50 day DMA | 1039.44 | | 100 day DMA | 1044.51 | | 150 day DMA | 1039.55 | | 200 day DMA | | EMA (exponential moving average) of Tax Free 729IRFC26_NN
| EMA period | EMA current | EMA prev | EMA prev2 | | 5 day EMA | 1023.03 | 1020.55 | 1020.82 | | 12 day EMA | 1022.28 | 1021.24 | 1021.46 | | 20 day EMA | 1023.86 | 1023.42 | 1023.78 | | 35 day EMA | 1031.43 | 1031.63 | 1032.31 | | 50 day EMA | 1039.69 | 1040.17 | 1040.99 |
SMA (simple moving average) of Tax Free 729IRFC26_NN
| SMA period | SMA current | SMA prev | SMA prev2 | | 5 day SMA | 1019.83 | 1020.23 | 1022.23 | | 12 day SMA | 1021.84 | 1022.01 | 1022.84 | | 20 day SMA | 1019.45 | 1018.35 | 1017.65 | | 35 day SMA | 1030.42 | 1031.54 | 1032.88 | | 50 day SMA | 1039.44 | 1040.25 | 1041.22 | | 100 day SMA | 1044.51 | 1044.52 | 1044.68 | | 150 day SMA | 1039.55 | 1039.93 | 1040.33 | | 200 day SMA |
|
|
