TaxFree 728IRFC30_NG full analysis,charts,indicators,moving averages,SMA,DMA,EMA,ADX,MACD,RSITax Free 728IRFC30_NG WideScreen charts, DMA,SMA,EMA technical analysis, forecast prediction, by indicators ADX,MACD,RSI,CCI NSE stock exchange
Daily price and charts and targets TaxFree Strong Daily Stock price targets for TaxFree 728IRFC30_NG are 1105 and 1105 | Daily Target 1 | 1105 | | Daily Target 2 | 1105 | | Daily Target 3 | 1105 | | Daily Target 4 | 1105 | | Daily Target 5 | 1105 |
Daily price and volume Tax Free
| Date |
Closing |
Open |
Range |
Volume |
Fri 19 December 2025 |
1105.00 (0.73%) |
1105.00 |
1105.00 - 1105.00 |
0.0116 times |
Mon 10 November 2025 |
1097.00 (1.34%) |
1097.00 |
1097.00 - 1097.00 |
0.029 times |
Mon 13 October 2025 |
1082.50 (0.23%) |
1082.50 |
1082.50 - 1082.50 |
0.664 times |
Thu 09 October 2025 |
1080.00 (-5.2%) |
1080.00 |
1080.00 - 1080.00 |
0.3199 times |
Wed 03 September 2025 |
1139.20 (0.52%) |
1139.10 |
1139.10 - 1139.20 |
0.4056 times |
Thu 07 August 2025 |
1133.35 (0%) |
1133.30 |
1133.30 - 1133.35 |
6.9475 times |
Tue 29 July 2025 |
1133.30 (0.27%) |
1133.30 |
1133.30 - 1133.30 |
0.0012 times |
Wed 23 July 2025 |
1130.20 (-0.03%) |
1130.10 |
1130.10 - 1130.20 |
0.4612 times |
Mon 21 July 2025 |
1130.50 (-15.06%) |
1130.50 |
1130.50 - 1130.50 |
1.1589 times |
Mon 07 July 2025 |
1330.90 (19.36%) |
1330.90 |
1330.90 - 1330.90 |
0.0012 times |
Thu 29 May 2025 |
1115.00 (0%) |
1115.00 |
1115.00 - 1115.00 |
2.0837 times |
Weekly price and charts TaxFree Strong weekly Stock price targets for TaxFree 728IRFC30_NG are 1101 and 1109 | Weekly Target 1 | 1094.33 | | Weekly Target 2 | 1099.67 | | Weekly Target 3 | 1102.3333333333 | | Weekly Target 4 | 1107.67 | | Weekly Target 5 | 1110.33 |
Weekly price and volumes for Tax Free
| Date |
Closing |
Open |
Range |
Volume |
Fri 19 December 2025 |
1105.00 (2.08%) |
1097.00 |
1097.00 - 1105.00 |
0.0197 times |
Mon 13 October 2025 |
1082.50 (0.23%) |
1082.50 |
1082.50 - 1082.50 |
0.3227 times |
Thu 09 October 2025 |
1080.00 (-4.71%) |
1139.10 |
1080.00 - 1139.20 |
0.3526 times |
Thu 07 August 2025 |
1133.35 (0.28%) |
1133.30 |
1133.30 - 1133.35 |
3.3771 times |
Wed 23 July 2025 |
1130.20 (-15.08%) |
1130.50 |
1130.10 - 1130.50 |
0.7874 times |
Mon 07 July 2025 |
1330.90 (19.36%) |
1330.90 |
1330.90 - 1330.90 |
0.0006 times |
Thu 29 May 2025 |
1115.00 (0%) |
1115.00 |
1115.00 - 1115.00 |
1.0127 times |
Thu 17 April 2025 |
1115.00 (0.99%) |
1099.35 |
1099.35 - 1115.00 |
3.2211 times |
Fri 28 February 2025 |
1104.02 (0%) |
1093.10 |
1093.10 - 1104.90 |
0.343 times |
Fri 21 February 2025 |
1104.00 (0.54%) |
1093.01 |
1093.01 - 1104.00 |
0.5632 times |
Fri 14 February 2025 |
1098.10 (-0.53%) |
1099.08 |
1093.01 - 1104.00 |
4.9333 times |

Monthly price and charts TaxFree Strong monthly Stock price targets for TaxFree 728IRFC30_NG are 1105 and 1105 | Monthly Target 1 | 1105 | | Monthly Target 2 | 1105 | | Monthly Target 3 | 1105 | | Monthly Target 4 | 1105 | | Monthly Target 5 | 1105 |
Monthly price and volumes Tax Free
| Date |
Closing |
Open |
Range |
Volume |
Fri 19 December 2025 |
1105.00 (0.73%) |
1105.00 |
1105.00 - 1105.00 |
0.0054 times |
Mon 10 November 2025 |
1097.00 (1.34%) |
1097.00 |
1097.00 - 1097.00 |
0.0136 times |
Mon 13 October 2025 |
1082.50 (-4.98%) |
1080.00 |
1080.00 - 1082.50 |
0.4622 times |
Wed 03 September 2025 |
1139.20 (0.52%) |
1139.10 |
1139.10 - 1139.20 |
0.1905 times |
Thu 07 August 2025 |
1133.35 (0%) |
1133.30 |
1133.30 - 1133.35 |
3.2635 times |
Tue 29 July 2025 |
1133.30 (1.64%) |
1330.90 |
1130.10 - 1330.90 |
0.7621 times |
Thu 29 May 2025 |
1115.00 (0%) |
1115.00 |
1115.00 - 1115.00 |
0.9788 times |
Thu 17 April 2025 |
1115.00 (0.81%) |
1114.00 |
1114.00 - 1115.00 |
2.4328 times |
Wed 12 March 2025 |
1106.00 (0.18%) |
1099.35 |
1099.35 - 1106.00 |
0.6805 times |
Fri 28 February 2025 |
1104.02 (1%) |
1098.10 |
1093.01 - 1104.90 |
1.2107 times |
Thu 30 January 2025 |
1093.11 (4.11%) |
1096.01 |
1050.00 - 1107.00 |
8.6532 times |

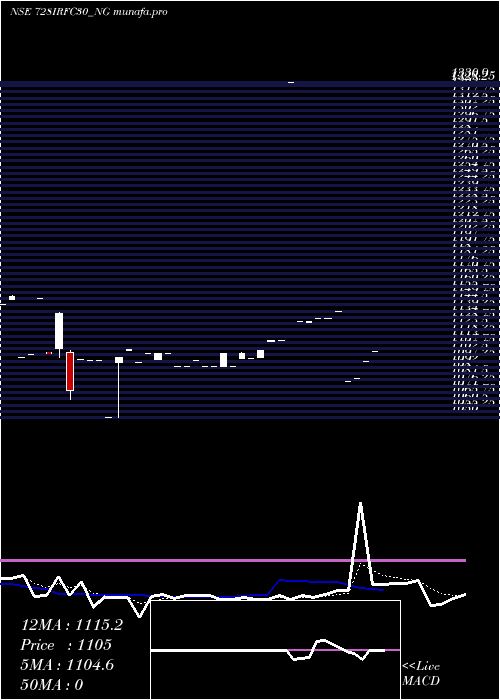
DMA SMA EMA moving averages of Tax Free 728IRFC30_NG
DMA (daily moving average) of Tax Free 728IRFC30_NG
| DMA period | DMA value | | 5 day DMA | 1100.74 | | 12 day DMA | 1132.66 | | 20 day DMA | 1119.13 | | 35 day DMA | 1109.81 | | 50 day DMA | | | 100 day DMA | | | 150 day DMA | | | 200 day DMA | | EMA (exponential moving average) of Tax Free 728IRFC30_NG
| EMA period | EMA current | EMA prev | EMA prev2 | | 5 day EMA | 1104.59 | 1104.39 | 1108.09 | | 12 day EMA | 1115.21 | 1117.06 | 1120.71 | | 20 day EMA | 1117.5 | 1118.82 | 1121.12 | | 35 day EMA | 1114.43 | 1114.98 | 1116.04 | | 50 day EMA | 0 | 0 | 0 |
SMA (simple moving average) of Tax Free 728IRFC30_NG
| SMA period | SMA current | SMA prev | SMA prev2 | | 5 day SMA | 1100.74 | 1106.41 | 1113.67 | | 12 day SMA | 1132.66 | 1132.75 | 1132.94 | | 20 day SMA | 1119.13 | 1118.53 | 1118.34 | | 35 day SMA | 1109.81 | 1111.09 | 1111.26 | | 50 day SMA | | 100 day SMA | | 150 day SMA | | 200 day SMA |
|
|
