GoiTbill 364D120226_TB full analysis,charts,indicators,moving averages,SMA,DMA,EMA,ADX,MACD,RSIGoi Tbill 364D120226_TB WideScreen charts, DMA,SMA,EMA technical analysis, forecast prediction, by indicators ADX,MACD,RSI,CCI NSE stock exchange
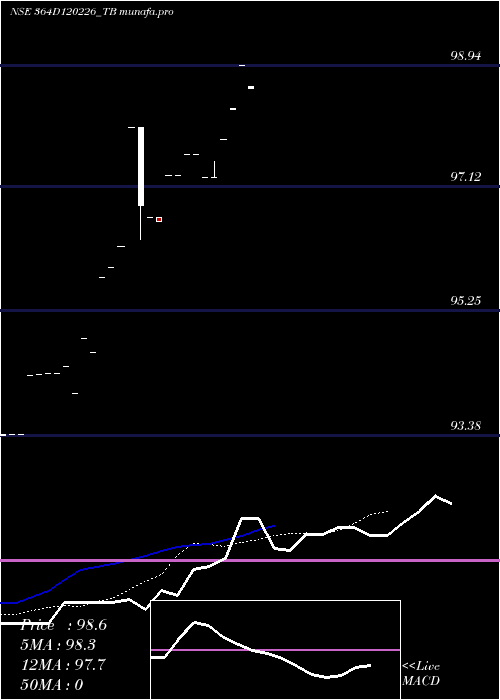
Daily price and charts and targets GoiTbill Strong Daily Stock price targets for GoiTbill 364D120226_TB are 98.62 and 98.65 | Daily Target 1 | 98.59 | | Daily Target 2 | 98.61 | | Daily Target 3 | 98.62 | | Daily Target 4 | 98.64 | | Daily Target 5 | 98.65 |
Daily price and volume Goi Tbill
| Date |
Closing |
Open |
Range |
Volume |
Sat 13 December 2025 |
98.63 (-0.31%) |
98.60 |
98.60 - 98.63 |
0.1227 times |
Thu 11 December 2025 |
98.94 (0.66%) |
98.94 |
98.94 - 98.94 |
0.2454 times |
Thu 20 November 2025 |
98.29 (0.47%) |
98.28 |
98.28 - 98.29 |
0.1227 times |
Mon 22 September 2025 |
97.83 (0.6%) |
97.83 |
97.83 - 97.83 |
3.8037 times |
Wed 17 September 2025 |
97.25 (0%) |
97.25 |
97.25 - 97.50 |
2.9448 times |
Tue 16 September 2025 |
97.25 (-0.36%) |
97.25 |
97.25 - 97.25 |
1.8405 times |
Mon 15 September 2025 |
97.60 (0%) |
97.60 |
97.60 - 97.60 |
0.0613 times |
Thu 11 September 2025 |
97.60 (0.33%) |
97.60 |
97.60 - 97.60 |
0.0613 times |
Thu 04 September 2025 |
97.28 (0%) |
97.28 |
97.28 - 97.28 |
0.0613 times |
Tue 19 August 2025 |
97.28 (0.7%) |
97.28 |
97.28 - 97.28 |
0.7362 times |
Wed 13 August 2025 |
96.60 (-0.06%) |
96.66 |
96.60 - 96.66 |
0.6748 times |
Weekly price and charts GoiTbill Strong weekly Stock price targets for GoiTbill 364D120226_TB are 98.45 and 98.79 | Weekly Target 1 | 98.38 | | Weekly Target 2 | 98.51 | | Weekly Target 3 | 98.723333333333 | | Weekly Target 4 | 98.85 | | Weekly Target 5 | 99.06 |
Weekly price and volumes for Goi Tbill
| Date |
Closing |
Open |
Range |
Volume |
Sat 13 December 2025 |
98.63 (0.35%) |
98.94 |
98.60 - 98.94 |
0.043 times |
Thu 20 November 2025 |
98.29 (1.07%) |
97.83 |
97.83 - 98.29 |
0.4588 times |
Wed 17 September 2025 |
97.25 (-0.36%) |
97.60 |
97.25 - 97.60 |
0.5663 times |
Thu 11 September 2025 |
97.60 (0.33%) |
97.60 |
97.60 - 97.60 |
0.0072 times |
Thu 04 September 2025 |
97.28 (0.7%) |
97.28 |
97.28 - 97.28 |
0.0932 times |
Wed 13 August 2025 |
96.60 (-1.43%) |
96.83 |
96.33 - 98.00 |
0.8172 times |
Fri 18 July 2025 |
98.00 (2.19%) |
96.22 |
96.22 - 98.00 |
7.2186 times |
Tue 03 June 2025 |
95.90 (1.34%) |
95.75 |
95.75 - 95.90 |
0.0215 times |
Wed 09 April 2025 |
94.63 (0.67%) |
94.83 |
94.63 - 94.83 |
0.7527 times |
Wed 02 April 2025 |
94.00 (-0.33%) |
94.41 |
94.00 - 94.41 |
0.0215 times |
Thu 13 March 2025 |
94.31 (0.99%) |
94.28 |
94.28 - 94.31 |
0.043 times |

Monthly price and charts GoiTbill Strong monthly Stock price targets for GoiTbill 364D120226_TB are 98.45 and 98.79 | Monthly Target 1 | 98.38 | | Monthly Target 2 | 98.51 | | Monthly Target 3 | 98.723333333333 | | Monthly Target 4 | 98.85 | | Monthly Target 5 | 99.06 |
Monthly price and volumes Goi Tbill
| Date |
Closing |
Open |
Range |
Volume |
Sat 13 December 2025 |
98.63 (0.35%) |
98.94 |
98.60 - 98.94 |
0.0384 times |
Thu 20 November 2025 |
98.29 (0.47%) |
98.28 |
98.28 - 98.29 |
0.0128 times |
Mon 22 September 2025 |
97.83 (0.57%) |
97.28 |
97.25 - 97.83 |
0.916 times |
Tue 19 August 2025 |
97.28 (-0.73%) |
96.66 |
96.60 - 97.28 |
0.1537 times |
Mon 21 July 2025 |
98.00 (1.85%) |
98.00 |
96.33 - 98.00 |
0.6982 times |
Mon 09 June 2025 |
96.22 (0.49%) |
95.90 |
95.90 - 96.22 |
6.4121 times |
Mon 26 May 2025 |
95.75 (1.18%) |
95.75 |
95.75 - 95.75 |
0.0128 times |
Wed 09 April 2025 |
94.63 (0.23%) |
94.00 |
94.00 - 94.83 |
0.6854 times |
Tue 18 March 2025 |
94.41 (0%) |
93.38 |
93.38 - 94.41 |
0.0705 times |
Sun 14 December 2025 |
(0%) |
|
- |
0 times |

DMA SMA EMA moving averages of Goi Tbill 364D120226_TB
DMA (daily moving average) of Goi Tbill 364D120226_TB
| DMA period | DMA value | | 5 day DMA | 98.19 | | 12 day DMA | 97.6 | | 20 day DMA | 96.93 | | 35 day DMA | | | 50 day DMA | | | 100 day DMA | | | 150 day DMA | | | 200 day DMA | | EMA (exponential moving average) of Goi Tbill 364D120226_TB
| EMA period | EMA current | EMA prev | EMA prev2 | | 5 day EMA | 98.31 | 98.15 | 97.75 | | 12 day EMA | 97.65 | 97.47 | 97.2 | | 20 day EMA | 96.82 | 96.63 | 96.39 | | 35 day EMA | 0 | 0 | 0 | | 50 day EMA | 0 | 0 | 0 |
SMA (simple moving average) of Goi Tbill 364D120226_TB
| SMA period | SMA current | SMA prev | SMA prev2 | | 5 day SMA | 98.19 | 97.91 | 97.64 | | 12 day SMA | 97.6 | 97.55 | 97.47 | | 20 day SMA | 96.93 | 96.72 | 96.48 | | 35 day SMA | | 50 day SMA | | 100 day SMA | | 150 day SMA | | 200 day SMA |
|
|
