GoiTbill 364D080126_TB full analysis,charts,indicators,moving averages,SMA,DMA,EMA,ADX,MACD,RSIGoi Tbill 364D080126_TB WideScreen charts, DMA,SMA,EMA technical analysis, forecast prediction, by indicators ADX,MACD,RSI,CCI NSE stock exchange
Daily price and charts and targets GoiTbill Strong Daily Stock price targets for GoiTbill 364D080126_TB are 96.64 and 96.64 | Daily Target 1 | 96.64 | | Daily Target 2 | 96.64 | | Daily Target 3 | 96.64 | | Daily Target 4 | 96.64 | | Daily Target 5 | 96.64 |
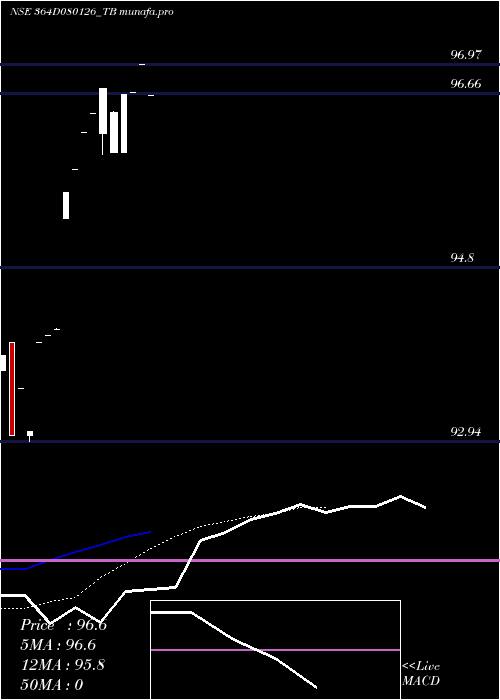
Daily price and volume Goi Tbill
| Date |
Closing |
Open |
Range |
Volume |
Wed 02 July 2025 |
96.64 (-0.34%) |
96.64 |
96.64 - 96.64 |
0.0816 times |
Tue 24 June 2025 |
96.97 (0.31%) |
96.97 |
96.97 - 96.97 |
0.0408 times |
Wed 18 June 2025 |
96.67 (0.02%) |
96.67 |
96.67 - 96.67 |
0.0041 times |
Tue 17 June 2025 |
96.65 (0.2%) |
96.03 |
96.03 - 96.65 |
0.0367 times |
Mon 16 June 2025 |
96.46 (-0.25%) |
96.03 |
96.03 - 96.47 |
1.6565 times |
Fri 13 June 2025 |
96.70 (0.27%) |
96.23 |
96.00 - 96.70 |
8.1599 times |
Tue 03 June 2025 |
96.44 (0.21%) |
96.44 |
96.44 - 96.44 |
0.0041 times |
Wed 21 May 2025 |
96.24 (0.42%) |
96.24 |
96.24 - 96.24 |
0.0041 times |
Mon 19 May 2025 |
95.84 (0.25%) |
95.84 |
95.84 - 95.84 |
0.0041 times |
Mon 12 May 2025 |
95.60 (1.55%) |
95.32 |
95.32 - 95.60 |
0.0082 times |
Tue 11 March 2025 |
94.14 (0.07%) |
94.14 |
94.14 - 94.15 |
0.0082 times |
Weekly price and charts GoiTbill Strong weekly Stock price targets for GoiTbill 364D080126_TB are 96.48 and 96.81 | Weekly Target 1 | 96.42 | | Weekly Target 2 | 96.53 | | Weekly Target 3 | 96.75 | | Weekly Target 4 | 96.86 | | Weekly Target 5 | 97.08 |
Weekly price and volumes for Goi Tbill
| Date |
Closing |
Open |
Range |
Volume |
Wed 02 July 2025 |
96.64 (-0.03%) |
96.97 |
96.64 - 96.97 |
0.0855 times |
Wed 18 June 2025 |
96.67 (-0.03%) |
96.03 |
96.03 - 96.67 |
1.1852 times |
Fri 13 June 2025 |
96.70 (0.48%) |
96.44 |
96.00 - 96.70 |
5.7009 times |
Wed 21 May 2025 |
96.24 (0.67%) |
95.84 |
95.84 - 96.24 |
0.0057 times |
Mon 12 May 2025 |
95.60 (1.55%) |
95.32 |
95.32 - 95.60 |
0.0057 times |
Tue 11 March 2025 |
94.14 (0.07%) |
94.14 |
94.14 - 94.15 |
0.0057 times |
Wed 22 January 2025 |
94.07 (0%) |
94.00 |
94.00 - 94.07 |
0.0114 times |
Thu 03 July 2025 |
(0%) |
|
- |
0 times |

Monthly price and charts GoiTbill Strong monthly Stock price targets for GoiTbill 364D080126_TB are 96.64 and 96.64 | Monthly Target 1 | 96.64 | | Monthly Target 2 | 96.64 | | Monthly Target 3 | 96.64 | | Monthly Target 4 | 96.64 | | Monthly Target 5 | 96.64 |
Monthly price and volumes Goi Tbill
| Date |
Closing |
Open |
Range |
Volume |
Wed 02 July 2025 |
96.64 (-0.34%) |
96.64 |
96.64 - 96.64 |
0.0389 times |
Tue 24 June 2025 |
96.97 (0.76%) |
96.44 |
96.00 - 96.97 |
4.7255 times |
Wed 21 May 2025 |
96.24 (2.23%) |
95.32 |
95.32 - 96.24 |
0.0078 times |
Tue 11 March 2025 |
94.14 (0.07%) |
94.14 |
94.14 - 94.15 |
0.0039 times |
Wed 22 January 2025 |
94.07 (0%) |
93.70 |
92.94 - 94.07 |
0.2239 times |
Thu 03 July 2025 |
(0%) |
|
- |
0 times |

DMA SMA EMA moving averages of Goi Tbill 364D080126_TB
DMA (daily moving average) of Goi Tbill 364D080126_TB
| DMA period | DMA value | | 5 day DMA | 96.68 | | 12 day DMA | 96.04 | | 20 day DMA | | | 35 day DMA | | | 50 day DMA | | | 100 day DMA | | | 150 day DMA | | | 200 day DMA | | EMA (exponential moving average) of Goi Tbill 364D080126_TB
| EMA period | EMA current | EMA prev | EMA prev2 | | 5 day EMA | 96.63 | 96.62 | 96.45 | | 12 day EMA | 95.83 | 95.68 | 95.45 | | 20 day EMA | 0 | 0 | 0 | | 35 day EMA | 0 | 0 | 0 | | 50 day EMA | 0 | 0 | 0 |
SMA (simple moving average) of Goi Tbill 364D080126_TB
| SMA period | SMA current | SMA prev | SMA prev2 | | 5 day SMA | 96.68 | 96.69 | 96.58 | | 12 day SMA | 96.04 | 95.82 | 95.49 | | 20 day SMA | | 35 day SMA | | 50 day SMA | | 100 day SMA | | 150 day SMA | | 200 day SMA |
|
|
