21stCentury 21STCENMGM_BE full analysis,charts,indicators,moving averages,SMA,DMA,EMA,ADX,MACD,RSI21st Century 21STCENMGM_BE WideScreen charts, DMA,SMA,EMA technical analysis, forecast prediction, by indicators ADX,MACD,RSI,CCI NSE stock exchange
Daily price and charts and targets 21stCentury Strong Daily Stock price targets for 21stCentury 21STCENMGM_BE are 78.8 and 79.27 | Daily Target 1 | 78.72 | | Daily Target 2 | 78.87 | | Daily Target 3 | 79.186666666667 | | Daily Target 4 | 79.34 | | Daily Target 5 | 79.66 |
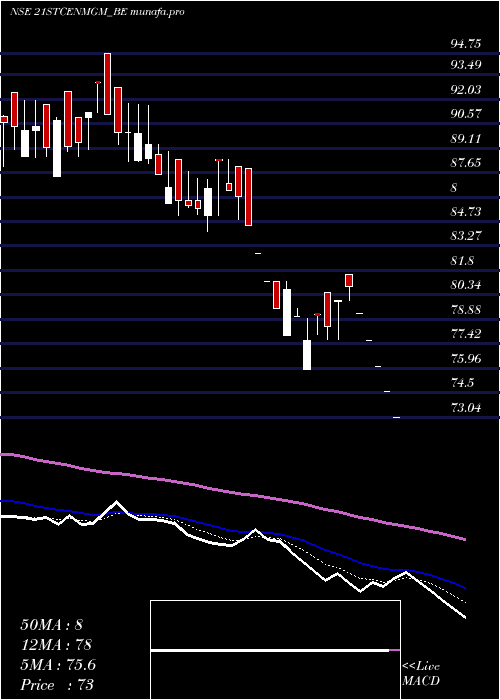
Daily price and volume 21st Century
| Date |
Closing |
Open |
Range |
Volume |
Fri 31 January 2025 |
79.03 (-2.01%) |
79.03 |
79.03 - 79.50 |
0.3094 times |
Thu 30 January 2025 |
80.65 (1.42%) |
77.92 |
77.92 - 81.11 |
1.8079 times |
Wed 29 January 2025 |
79.52 (-2.01%) |
81.15 |
79.52 - 81.15 |
0.779 times |
Tue 28 January 2025 |
81.15 (-2%) |
81.15 |
81.15 - 81.15 |
0.2035 times |
Mon 27 January 2025 |
82.81 (-2.01%) |
82.81 |
82.81 - 82.81 |
0.1649 times |
Fri 24 January 2025 |
84.51 (-2.01%) |
87.90 |
84.51 - 87.90 |
1.0432 times |
Thu 23 January 2025 |
86.24 (-0.39%) |
88.00 |
84.84 - 88.00 |
0.6442 times |
Wed 22 January 2025 |
86.58 (-2%) |
87.00 |
86.58 - 88.45 |
0.3199 times |
Tue 21 January 2025 |
88.35 (1.89%) |
88.43 |
85.10 - 88.43 |
3.369 times |
Mon 20 January 2025 |
86.71 (1.42%) |
85.10 |
84.15 - 87.21 |
1.359 times |
Fri 17 January 2025 |
85.50 (-0.18%) |
86.00 |
85.12 - 87.30 |
0.5759 times |
Weekly price and charts 21stCentury Strong weekly Stock price targets for 21stCentury 21STCENMGM_BE are 76.03 and 80.92 | Weekly Target 1 | 75.03 | | Weekly Target 2 | 77.03 | | Weekly Target 3 | 79.92 | | Weekly Target 4 | 81.92 | | Weekly Target 5 | 84.81 |
Weekly price and volumes for 21st Century
| Date |
Closing |
Open |
Range |
Volume |
Fri 31 January 2025 |
79.03 (-6.48%) |
82.81 |
77.92 - 82.81 |
0.329 times |
Fri 24 January 2025 |
84.51 (-1.16%) |
85.10 |
84.15 - 88.45 |
0.6788 times |
Fri 17 January 2025 |
85.50 (-4.29%) |
88.75 |
85.05 - 89.33 |
0.4095 times |
Fri 10 January 2025 |
89.33 (-3.95%) |
94.75 |
88.19 - 94.75 |
0.5442 times |
Fri 03 January 2025 |
93.00 (4.32%) |
87.40 |
87.40 - 93.03 |
0.6486 times |
Fri 27 December 2024 |
89.15 (-1.63%) |
92.44 |
88.55 - 92.44 |
0.617 times |
Fri 20 December 2024 |
90.63 (-2.41%) |
91.01 |
87.48 - 93.01 |
1.1628 times |
Fri 13 December 2024 |
92.87 (-6.87%) |
98.00 |
92.10 - 101.71 |
1.282 times |
Fri 06 December 2024 |
99.72 (4.42%) |
93.59 |
91.71 - 101.28 |
1.9365 times |
Fri 29 November 2024 |
95.50 (-5.64%) |
99.18 |
94.05 - 103.23 |
2.3916 times |
Fri 22 November 2024 |
101.21 (-7.78%) |
107.55 |
101.21 - 107.55 |
0.5685 times |

Monthly price and charts 21stCentury Strong monthly Stock price targets for 21stCentury 21STCENMGM_BE are 70.06 and 86.89 | Monthly Target 1 | 67.07 | | Monthly Target 2 | 73.05 | | Monthly Target 3 | 83.9 | | Monthly Target 4 | 89.88 | | Monthly Target 5 | 100.73 |
Monthly price and volumes 21st Century
| Date |
Closing |
Open |
Range |
Volume |
Fri 31 January 2025 |
79.03 (-11.38%) |
90.96 |
77.92 - 94.75 |
0.488 times |
Tue 31 December 2024 |
89.18 (-6.62%) |
93.59 |
87.40 - 101.71 |
1.1939 times |
Fri 29 November 2024 |
95.50 (-13.79%) |
112.99 |
94.05 - 121.44 |
1.1862 times |
Thu 31 October 2024 |
110.78 (3.53%) |
104.86 |
96.70 - 122.64 |
1.0019 times |
Mon 30 September 2024 |
107.00 (-11.36%) |
123.12 |
107.00 - 141.40 |
1.1903 times |
Fri 30 August 2024 |
120.71 (45.5%) |
84.61 |
84.61 - 120.71 |
0.8674 times |
Wed 31 July 2024 |
82.96 (24.6%) |
67.91 |
67.91 - 82.96 |
0.8016 times |
Fri 28 June 2024 |
66.58 (35.33%) |
50.15 |
47.65 - 66.58 |
1.496 times |
Fri 31 May 2024 |
49.20 (-2.86%) |
51.65 |
42.70 - 54.50 |
0.7593 times |
Tue 30 April 2024 |
50.65 (21.75%) |
41.50 |
41.50 - 55.00 |
1.0153 times |
Thu 28 March 2024 |
41.60 (-17.46%) |
49.40 |
40.40 - 51.35 |
1.0406 times |

DMA SMA EMA moving averages of 21st Century 21STCENMGM_BE
DMA (daily moving average) of 21st Century 21STCENMGM_BE
| DMA period | DMA value | | 5 day DMA | 80.63 | | 12 day DMA | 83.89 | | 20 day DMA | 85.88 | | 35 day DMA | 87.87 | | 50 day DMA | 90.7 | | 100 day DMA | 102.55 | | 150 day DMA | 99.4 | | 200 day DMA | 87.42 | EMA (exponential moving average) of 21st Century 21STCENMGM_BE
| EMA period | EMA current | EMA prev | EMA prev2 | | 5 day EMA | 80.84 | 81.74 | 82.28 | | 12 day EMA | 83.26 | 84.03 | 84.64 | | 20 day EMA | 85.18 | 85.83 | 86.37 | | 35 day EMA | 88.31 | 88.86 | 89.34 | | 50 day EMA | 91.07 | 91.56 | 92.01 |
SMA (simple moving average) of 21st Century 21STCENMGM_BE
| SMA period | SMA current | SMA prev | SMA prev2 | | 5 day SMA | 80.63 | 81.73 | 82.85 | | 12 day SMA | 83.89 | 84.47 | 84.98 | | 20 day SMA | 85.88 | 86.58 | 87.1 | | 35 day SMA | 87.87 | 88.3 | 88.73 | | 50 day SMA | 90.7 | 91.18 | 91.68 | | 100 day SMA | 102.55 | 103.12 | 103.64 | | 150 day SMA | 99.4 | 99.31 | 99.2 | | 200 day SMA | 87.42 | 87.28 | 87.12 |
|
|
