GoiTbill 182D300125_TB full analysis,charts,indicators,moving averages,SMA,DMA,EMA,ADX,MACD,RSIGoi Tbill 182D300125_TB WideScreen charts, DMA,SMA,EMA technical analysis, forecast prediction, by indicators ADX,MACD,RSI,CCI NSE stock exchange
Daily price and charts and targets GoiTbill Strong Daily Stock price targets for GoiTbill 182D300125_TB are 99.87 and 100.04 | Daily Target 1 | 99.72 | | Daily Target 2 | 99.84 | | Daily Target 3 | 99.893333333333 | | Daily Target 4 | 100.01 | | Daily Target 5 | 100.06 |
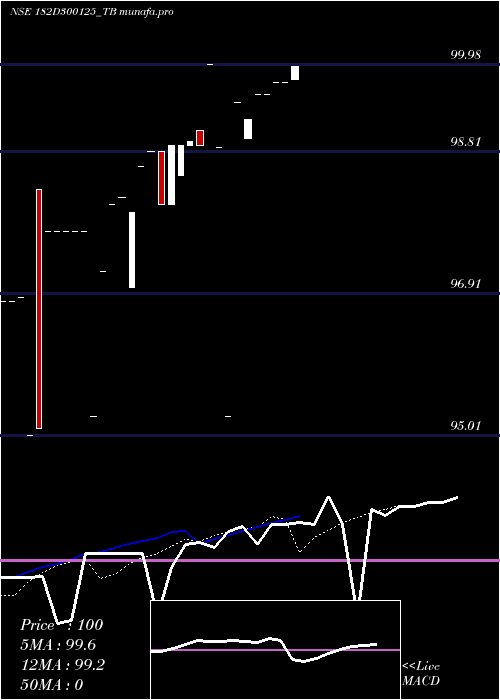
Daily price and volume Goi Tbill
| Date |
Closing |
Open |
Range |
Volume |
Mon 27 January 2025 |
99.95 (0.2%) |
99.78 |
99.78 - 99.95 |
2.2167 times |
Thu 23 January 2025 |
99.75 (0%) |
99.74 |
99.74 - 99.75 |
0.1478 times |
Wed 22 January 2025 |
99.75 (0.17%) |
99.74 |
99.74 - 99.75 |
0.0493 times |
Wed 15 January 2025 |
99.58 (0%) |
99.58 |
99.58 - 99.58 |
0.0246 times |
Wed 08 January 2025 |
99.58 (0.33%) |
99.58 |
99.58 - 99.58 |
0.0246 times |
Mon 06 January 2025 |
99.25 (-0.22%) |
99.00 |
99.00 - 99.25 |
7.3153 times |
Mon 30 December 2024 |
99.47 (4.42%) |
99.47 |
99.47 - 99.47 |
0.1478 times |
Mon 16 December 2024 |
95.26 (-3.65%) |
95.26 |
95.26 - 95.26 |
0.0246 times |
Thu 12 December 2024 |
98.87 (-1.11%) |
98.87 |
98.87 - 98.87 |
0.0246 times |
Wed 11 December 2024 |
99.98 (1.09%) |
99.98 |
99.98 - 99.98 |
0.0246 times |
Mon 09 December 2024 |
98.90 (-0.06%) |
99.09 |
98.90 - 99.09 |
2.7094 times |
Weekly price and charts GoiTbill Strong weekly Stock price targets for GoiTbill 182D300125_TB are 99.87 and 100.04 | Weekly Target 1 | 99.72 | | Weekly Target 2 | 99.84 | | Weekly Target 3 | 99.893333333333 | | Weekly Target 4 | 100.01 | | Weekly Target 5 | 100.06 |
Weekly price and volumes for Goi Tbill
| Date |
Closing |
Open |
Range |
Volume |
Mon 27 January 2025 |
99.95 (0.2%) |
99.78 |
99.78 - 99.95 |
1.3333 times |
Thu 23 January 2025 |
99.75 (0.17%) |
99.74 |
99.74 - 99.75 |
0.1185 times |
Wed 15 January 2025 |
99.58 (0%) |
99.58 |
99.58 - 99.58 |
0.0148 times |
Wed 08 January 2025 |
99.58 (0.11%) |
99.00 |
99.00 - 99.58 |
4.4148 times |
Mon 30 December 2024 |
99.47 (4.42%) |
99.47 |
99.47 - 99.47 |
0.0889 times |
Mon 16 December 2024 |
95.26 (-3.65%) |
95.26 |
95.26 - 95.26 |
0.0148 times |
Thu 12 December 2024 |
98.87 (-0.09%) |
99.09 |
98.87 - 99.98 |
1.6593 times |
Fri 06 December 2024 |
98.96 (0.06%) |
98.50 |
98.50 - 98.96 |
0.2815 times |
Fri 29 November 2024 |
98.90 (0.28%) |
98.82 |
98.11 - 98.90 |
1.9704 times |
Thu 07 November 2024 |
98.62 (0.43%) |
97.00 |
97.00 - 98.62 |
0.1037 times |
Fri 01 November 2024 |
98.20 (3.09%) |
97.21 |
97.21 - 98.20 |
1.4222 times |

Monthly price and charts GoiTbill Strong monthly Stock price targets for GoiTbill 182D300125_TB are 99.48 and 100.43 | Monthly Target 1 | 98.68 | | Monthly Target 2 | 99.32 | | Monthly Target 3 | 99.633333333333 | | Monthly Target 4 | 100.27 | | Monthly Target 5 | 100.58 |
Monthly price and volumes Goi Tbill
| Date |
Closing |
Open |
Range |
Volume |
Mon 27 January 2025 |
99.95 (0.48%) |
99.00 |
99.00 - 99.95 |
2.959 times |
Mon 30 December 2024 |
99.47 (0.58%) |
98.50 |
95.26 - 99.98 |
1.0286 times |
Fri 29 November 2024 |
98.90 (0.82%) |
98.20 |
97.00 - 98.90 |
1.7143 times |
Thu 31 October 2024 |
98.10 (3.14%) |
97.75 |
95.26 - 98.10 |
0.2385 times |
Tue 24 September 2024 |
95.11 (-1.75%) |
96.86 |
95.01 - 98.30 |
0.0447 times |
Thu 29 August 2024 |
96.80 (0%) |
96.80 |
96.80 - 96.80 |
0.0149 times |
Mon 10 February 2025 |
(0%) |
|
- |
0 times |

DMA SMA EMA moving averages of Goi Tbill 182D300125_TB
DMA (daily moving average) of Goi Tbill 182D300125_TB
| DMA period | DMA value | | 5 day DMA | 99.72 | | 12 day DMA | 99.11 | | 20 day DMA | 98.85 | | 35 day DMA | | | 50 day DMA | | | 100 day DMA | | | 150 day DMA | | | 200 day DMA | | EMA (exponential moving average) of Goi Tbill 182D300125_TB
| EMA period | EMA current | EMA prev | EMA prev2 | | 5 day EMA | 99.64 | 99.49 | 99.36 | | 12 day EMA | 99.19 | 99.05 | 98.92 | | 20 day EMA | 98.72 | 98.59 | 98.47 | | 35 day EMA | 0 | 0 | 0 | | 50 day EMA | 0 | 0 | 0 |
SMA (simple moving average) of Goi Tbill 182D300125_TB
| SMA period | SMA current | SMA prev | SMA prev2 | | 5 day SMA | 99.72 | 99.58 | 99.53 | | 12 day SMA | 99.11 | 99.02 | 98.95 | | 20 day SMA | 98.85 | 98.71 | 98.49 | | 35 day SMA | | 50 day SMA | | 100 day SMA | | 150 day SMA | | 200 day SMA |
|
|
