GoiTbill 182D290825_TB full analysis,charts,indicators,moving averages,SMA,DMA,EMA,ADX,MACD,RSIGoi Tbill 182D290825_TB WideScreen charts, DMA,SMA,EMA technical analysis, forecast prediction, by indicators ADX,MACD,RSI,CCI NSE stock exchange
Daily price and charts and targets GoiTbill Strong Daily Stock price targets for GoiTbill 182D290825_TB are 99.15 and 99.17 | Daily Target 1 | 99.15 | | Daily Target 2 | 99.15 | | Daily Target 3 | 99.166666666667 | | Daily Target 4 | 99.17 | | Daily Target 5 | 99.19 |
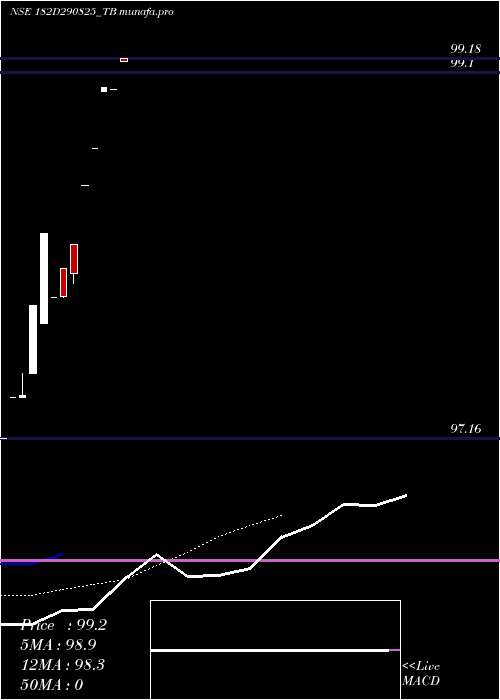
Daily price and volume Goi Tbill
| Date |
Closing |
Open |
Range |
Volume |
Fri 11 July 2025 |
99.16 (0.15%) |
99.18 |
99.16 - 99.18 |
2.6456 times |
Wed 25 June 2025 |
99.01 (-0.01%) |
99.01 |
99.01 - 99.01 |
0.1456 times |
Tue 24 June 2025 |
99.02 (0.32%) |
99.00 |
99.00 - 99.02 |
0.0728 times |
Tue 17 June 2025 |
98.70 (0.2%) |
98.70 |
98.70 - 98.70 |
0.0243 times |
Fri 13 June 2025 |
98.50 (0.48%) |
98.50 |
98.50 - 98.50 |
4.8544 times |
Thu 22 May 2025 |
98.03 (0.12%) |
98.19 |
97.98 - 98.19 |
0.4612 times |
Wed 14 May 2025 |
97.91 (0.01%) |
98.06 |
97.90 - 98.06 |
0.2427 times |
Tue 13 May 2025 |
97.90 (-0.36%) |
97.90 |
97.90 - 97.90 |
0.0243 times |
Mon 12 May 2025 |
98.25 (0.39%) |
97.77 |
97.77 - 98.25 |
0.7524 times |
Mon 21 April 2025 |
97.87 (0.5%) |
97.50 |
97.50 - 97.87 |
0.7767 times |
Thu 17 April 2025 |
97.38 (0.01%) |
97.37 |
97.37 - 97.50 |
0.267 times |
Weekly price and charts GoiTbill Strong weekly Stock price targets for GoiTbill 182D290825_TB are 99.08 and 99.26 | Weekly Target 1 | 98.93 | | Weekly Target 2 | 99.05 | | Weekly Target 3 | 99.113333333333 | | Weekly Target 4 | 99.23 | | Weekly Target 5 | 99.29 |
Weekly price and volumes for Goi Tbill
| Date |
Closing |
Open |
Range |
Volume |
Fri 11 July 2025 |
99.16 (0.47%) |
99.00 |
99.00 - 99.18 |
1.1456 times |
Tue 17 June 2025 |
98.70 (0.2%) |
98.70 |
98.70 - 98.70 |
0.0097 times |
Fri 13 June 2025 |
98.50 (0.64%) |
97.77 |
97.77 - 98.50 |
2.534 times |
Mon 21 April 2025 |
97.87 (0%) |
97.50 |
97.50 - 97.87 |
0.3107 times |
Sat 12 July 2025 |
(0%) |
|
- |
0 times |

Monthly price and charts GoiTbill Strong monthly Stock price targets for GoiTbill 182D290825_TB are 99.15 and 99.17 | Monthly Target 1 | 99.15 | | Monthly Target 2 | 99.15 | | Monthly Target 3 | 99.166666666667 | | Monthly Target 4 | 99.17 | | Monthly Target 5 | 99.19 |
Monthly price and volumes Goi Tbill
| Date |
Closing |
Open |
Range |
Volume |
Fri 11 July 2025 |
99.16 (0.15%) |
99.18 |
99.16 - 99.18 |
0.982 times |
Wed 25 June 2025 |
99.01 (1%) |
98.50 |
98.50 - 99.02 |
1.8919 times |
Thu 22 May 2025 |
98.03 (0.16%) |
97.77 |
97.77 - 98.25 |
0.5495 times |
Mon 21 April 2025 |
97.87 (0%) |
97.16 |
97.16 - 97.87 |
0.5766 times |
Sat 12 July 2025 |
(0%) |
|
- |
0 times |

DMA SMA EMA moving averages of Goi Tbill 182D290825_TB
DMA (daily moving average) of Goi Tbill 182D290825_TB
| DMA period | DMA value | | 5 day DMA | 98.88 | | 12 day DMA | | | 20 day DMA | | | 35 day DMA | | | 50 day DMA | | | 100 day DMA | | | 150 day DMA | | | 200 day DMA | | EMA (exponential moving average) of Goi Tbill 182D290825_TB
| EMA period | EMA current | EMA prev | EMA prev2 | | 5 day EMA | 98.85 | 98.69 | 98.53 | | 12 day EMA | 98.25 | 98.09 | | 20 day EMA | 0 | 0 | 0 | | 35 day EMA | 0 | 0 | 0 | | 50 day EMA | 0 | 0 | 0 |
SMA (simple moving average) of Goi Tbill 182D290825_TB
| SMA period | SMA current | SMA prev | SMA prev2 | | 5 day SMA | 98.88 | 98.65 | 98.43 | | 12 day SMA | | 20 day SMA | | 35 day SMA | | 50 day SMA | | 100 day SMA | | 150 day SMA | | 200 day SMA |
|
|
