GoiTbill 182D240425_TB full analysis,charts,indicators,moving averages,SMA,DMA,EMA,ADX,MACD,RSIGoi Tbill 182D240425_TB WideScreen charts, DMA,SMA,EMA technical analysis, forecast prediction, by indicators ADX,MACD,RSI,CCI NSE stock exchange
Daily price and charts and targets GoiTbill Strong Daily Stock price targets for GoiTbill 182D240425_TB are 98.69 and 98.71 | Daily Target 1 | 98.67 | | Daily Target 2 | 98.69 | | Daily Target 3 | 98.693333333333 | | Daily Target 4 | 98.71 | | Daily Target 5 | 98.71 |
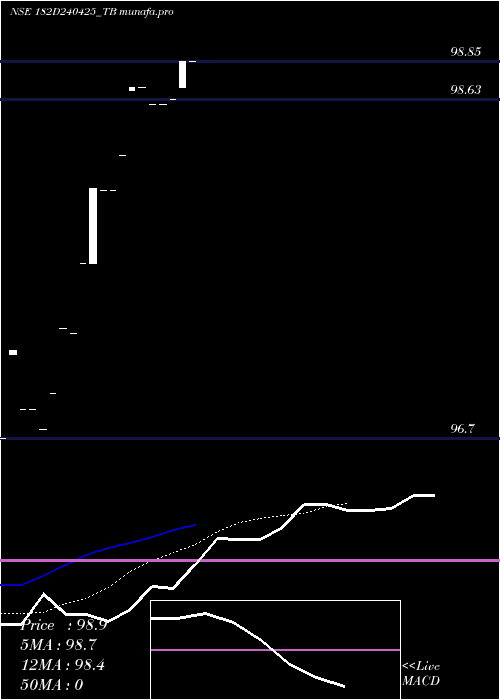
Daily price and volume Goi Tbill
| Date |
Closing |
Open |
Range |
Volume |
Mon 03 February 2025 |
98.70 (0.4%) |
98.68 |
98.68 - 98.70 |
0.4348 times |
Thu 23 January 2025 |
98.31 (0.19%) |
98.31 |
98.31 - 98.31 |
0.2174 times |
Fri 17 January 2025 |
98.12 (0%) |
98.12 |
98.12 - 98.12 |
0.2174 times |
Mon 13 January 2025 |
98.12 (-0.01%) |
98.12 |
98.12 - 98.12 |
0.4348 times |
Tue 07 January 2025 |
98.13 (0.44%) |
97.70 |
97.70 - 98.13 |
1.5217 times |
Mon 30 December 2024 |
97.70 (0.41%) |
97.70 |
97.70 - 97.70 |
0.2174 times |
Fri 27 December 2024 |
97.30 (-0.03%) |
97.30 |
97.30 - 97.30 |
0.2174 times |
Fri 06 December 2024 |
97.33 (0.39%) |
97.33 |
97.33 - 97.33 |
3.2609 times |
Thu 05 December 2024 |
96.95 (0.21%) |
96.95 |
96.95 - 96.95 |
0.2174 times |
Thu 14 November 2024 |
96.75 (-0.12%) |
96.75 |
96.75 - 96.75 |
3.2609 times |
Tue 12 November 2024 |
96.87 (0%) |
96.87 |
96.87 - 96.87 |
0.2174 times |
Weekly price and charts GoiTbill Strong weekly Stock price targets for GoiTbill 182D240425_TB are 98.69 and 98.71 | Weekly Target 1 | 98.67 | | Weekly Target 2 | 98.69 | | Weekly Target 3 | 98.693333333333 | | Weekly Target 4 | 98.71 | | Weekly Target 5 | 98.71 |
Weekly price and volumes for Goi Tbill
| Date |
Closing |
Open |
Range |
Volume |
Mon 03 February 2025 |
98.70 (0.4%) |
98.68 |
98.68 - 98.70 |
0.2917 times |
Thu 23 January 2025 |
98.31 (0.19%) |
98.31 |
98.31 - 98.31 |
0.1458 times |
Fri 17 January 2025 |
98.12 (-0.01%) |
98.12 |
98.12 - 98.12 |
0.4375 times |
Tue 07 January 2025 |
98.13 (0.85%) |
97.70 |
97.70 - 98.13 |
1.1667 times |
Fri 27 December 2024 |
97.30 (-0.03%) |
97.30 |
97.30 - 97.30 |
0.1458 times |
Fri 06 December 2024 |
97.33 (0.6%) |
96.95 |
96.95 - 97.33 |
2.3333 times |
Thu 14 November 2024 |
96.75 (0%) |
96.87 |
96.75 - 96.87 |
2.4792 times |
Wed 05 February 2025 |
(0%) |
|
- |
0 times |

Monthly price and charts GoiTbill Strong monthly Stock price targets for GoiTbill 182D240425_TB are 98.69 and 98.71 | Monthly Target 1 | 98.67 | | Monthly Target 2 | 98.69 | | Monthly Target 3 | 98.693333333333 | | Monthly Target 4 | 98.71 | | Monthly Target 5 | 98.71 |
Monthly price and volumes Goi Tbill
| Date |
Closing |
Open |
Range |
Volume |
Mon 03 February 2025 |
98.70 (0.4%) |
98.68 |
98.68 - 98.70 |
0.093 times |
Thu 23 January 2025 |
98.31 (0.62%) |
97.70 |
97.70 - 98.31 |
0.5116 times |
Mon 30 December 2024 |
97.70 (0.98%) |
96.95 |
96.95 - 97.70 |
0.8372 times |
Thu 14 November 2024 |
96.75 (0%) |
96.70 |
96.70 - 97.20 |
2.5581 times |
Wed 05 February 2025 |
(0%) |
|
- |
0 times |

DMA SMA EMA moving averages of Goi Tbill 182D240425_TB
DMA (daily moving average) of Goi Tbill 182D240425_TB
| DMA period | DMA value | | 5 day DMA | 98.28 | | 12 day DMA | 97.6 | | 20 day DMA | | | 35 day DMA | | | 50 day DMA | | | 100 day DMA | | | 150 day DMA | | | 200 day DMA | | EMA (exponential moving average) of Goi Tbill 182D240425_TB
| EMA period | EMA current | EMA prev | EMA prev2 | | 5 day EMA | 98.25 | 98.03 | 97.89 | | 12 day EMA | 97.68 | 97.49 | 97.34 | | 20 day EMA | 0 | 0 | 0 | | 35 day EMA | 0 | 0 | 0 | | 50 day EMA | 0 | 0 | 0 |
SMA (simple moving average) of Goi Tbill 182D240425_TB
| SMA period | SMA current | SMA prev | SMA prev2 | | 5 day SMA | 98.28 | 98.08 | 97.87 | | 12 day SMA | 97.6 | | 20 day SMA | | 35 day SMA | | 50 day SMA | | 100 day SMA | | 150 day SMA | | 200 day SMA |
|
|
