GoiTbill 182D200624_TB full analysis,charts,indicators,moving averages,SMA,DMA,EMA,ADX,MACD,RSIGoi Tbill 182D200624_TB WideScreen charts, DMA,SMA,EMA technical analysis, forecast prediction, by indicators ADX,MACD,RSI,CCI NSE stock exchange
Daily price and charts and targets GoiTbill Strong Daily Stock price targets for GoiTbill 182D200624_TB are 98.96 and 99.28 | Daily Target 1 | 98.69 | | Daily Target 2 | 98.91 | | Daily Target 3 | 99.013333333333 | | Daily Target 4 | 99.23 | | Daily Target 5 | 99.33 |
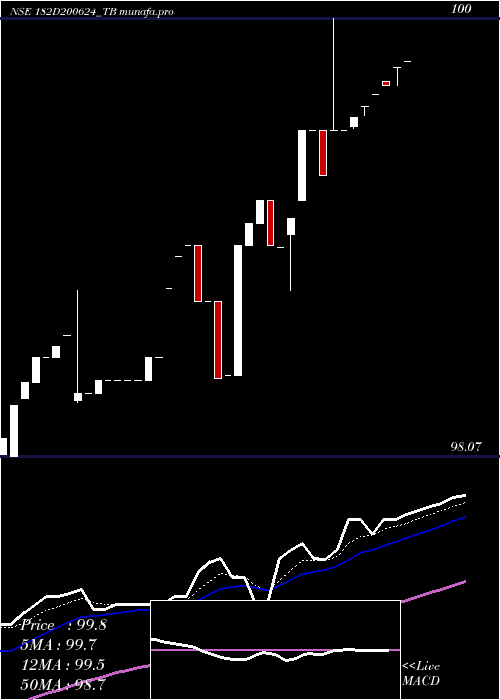
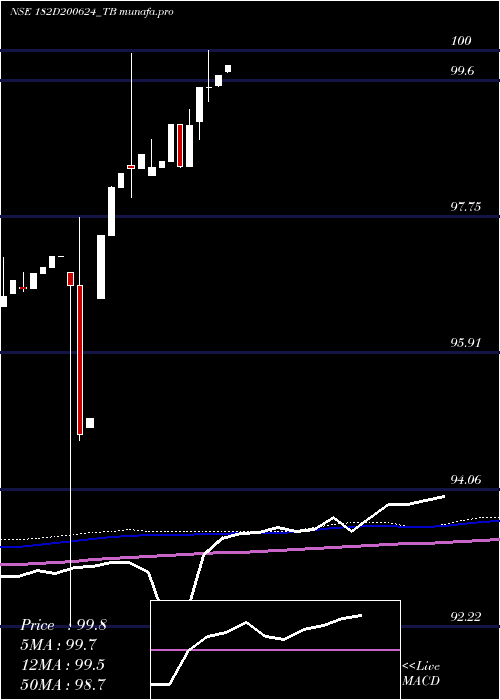
Daily price and volume Goi Tbill
| Date |
Closing |
Open |
Range |
Volume |
Thu 23 May 2024 |
99.12 (0.13%) |
99.05 |
98.80 - 99.12 |
3.0588 times |
Fri 17 May 2024 |
98.99 (-0.01%) |
98.99 |
98.99 - 98.99 |
0.1176 times |
Thu 16 May 2024 |
99.00 (-0.2%) |
99.20 |
99.00 - 99.20 |
0.3529 times |
Wed 15 May 2024 |
99.20 (0.1%) |
99.10 |
99.10 - 99.20 |
1.6471 times |
Tue 14 May 2024 |
99.10 (0.1%) |
99.00 |
99.00 - 99.10 |
1.4118 times |
Mon 13 May 2024 |
99.00 (0.58%) |
98.43 |
98.43 - 99.00 |
1.7647 times |
Fri 10 May 2024 |
98.43 (0.01%) |
98.43 |
98.43 - 98.43 |
0.1176 times |
Wed 08 May 2024 |
98.42 (-0.33%) |
98.75 |
98.42 - 98.75 |
1.0588 times |
Tue 07 May 2024 |
98.75 (0%) |
98.75 |
98.75 - 98.75 |
0.1176 times |
Mon 06 May 2024 |
98.75 (-0.25%) |
99.00 |
98.75 - 99.00 |
0.3529 times |
Fri 03 May 2024 |
99.00 (0.05%) |
99.00 |
99.00 - 99.00 |
0.2353 times |
Weekly price and charts GoiTbill Strong weekly Stock price targets for GoiTbill 182D200624_TB are 98.96 and 99.28 | Weekly Target 1 | 98.69 | | Weekly Target 2 | 98.91 | | Weekly Target 3 | 99.013333333333 | | Weekly Target 4 | 99.23 | | Weekly Target 5 | 99.33 |
Weekly price and volumes for Goi Tbill
| Date |
Closing |
Open |
Range |
Volume |
Thu 23 May 2024 |
99.12 (0.13%) |
99.05 |
98.80 - 99.12 |
0.4943 times |
Fri 17 May 2024 |
98.99 (0.57%) |
98.43 |
98.43 - 99.20 |
0.8555 times |
Fri 10 May 2024 |
98.43 (-0.58%) |
99.00 |
98.42 - 99.00 |
0.2662 times |
Fri 03 May 2024 |
99.00 (0.51%) |
98.50 |
98.50 - 99.00 |
0.1711 times |
Fri 26 April 2024 |
98.50 (0.09%) |
98.41 |
98.41 - 98.50 |
0.2281 times |
Fri 19 April 2024 |
98.41 (-0.19%) |
98.32 |
98.31 - 98.80 |
3.8023 times |
Fri 12 April 2024 |
98.60 (0.2%) |
98.40 |
98.40 - 98.60 |
0.8935 times |
Fri 05 April 2024 |
98.40 (0.06%) |
98.45 |
98.02 - 99.96 |
2.0532 times |
Wed 27 March 2024 |
98.34 (0.19%) |
98.15 |
98.15 - 98.34 |
0.4563 times |
Fri 22 March 2024 |
98.15 (0.67%) |
97.50 |
97.50 - 98.16 |
0.7795 times |
Fri 15 March 2024 |
97.50 (2.6%) |
96.65 |
96.65 - 97.50 |
2.3954 times |
Monthly price and charts GoiTbill Strong monthly Stock price targets for GoiTbill 182D200624_TB are 98.77 and 99.55 | Monthly Target 1 | 98.13 | | Monthly Target 2 | 98.63 | | Monthly Target 3 | 98.913333333333 | | Monthly Target 4 | 99.41 | | Monthly Target 5 | 99.69 |
Monthly price and volumes Goi Tbill
| Date |
Closing |
Open |
Range |
Volume |
Thu 23 May 2024 |
99.12 (0.31%) |
98.95 |
98.42 - 99.20 |
0.3249 times |
Tue 30 April 2024 |
98.81 (0.48%) |
98.45 |
98.02 - 99.96 |
1.3772 times |
Wed 27 March 2024 |
98.34 (0.61%) |
97.74 |
94.74 - 98.34 |
1.3034 times |
Wed 28 February 2024 |
97.74 (0.77%) |
97.06 |
92.22 - 97.74 |
0.2215 times |
Tue 30 January 2024 |
96.99 (0.43%) |
96.55 |
96.54 - 97.20 |
1.0597 times |
Fri 29 December 2023 |
96.57 (0%) |
96.42 |
96.42 - 96.77 |
1.7132 times |
Fri 24 May 2024 |
(0%) |
|
- |
0 times |

DMA SMA EMA moving averages of Goi Tbill 182D200624_TB
DMA (daily moving average) of Goi Tbill 182D200624_TB
| DMA period | DMA value | | 5 day DMA | 99.08 | | 12 day DMA | 98.89 | | 20 day DMA | 98.73 | | 35 day DMA | 98.55 | | 50 day DMA | 97.92 | | 100 day DMA | | | 150 day DMA | | | 200 day DMA | | EMA (exponential moving average) of Goi Tbill 182D200624_TB
| EMA period | EMA current | EMA prev | EMA prev2 | | 5 day EMA | 99.03 | 98.98 | 98.98 | | 12 day EMA | 98.89 | 98.85 | 98.82 | | 20 day EMA | 98.73 | 98.69 | 98.66 | | 35 day EMA | 98.34 | 98.29 | 98.25 | | 50 day EMA | 97.98 | 97.93 | 97.89 |
SMA (simple moving average) of Goi Tbill 182D200624_TB
| SMA period | SMA current | SMA prev | SMA prev2 | | 5 day SMA | 99.08 | 99.06 | 98.95 | | 12 day SMA | 98.89 | 98.87 | 98.83 | | 20 day SMA | 98.73 | 98.69 | 98.66 | | 35 day SMA | 98.55 | 98.52 | 98.48 | | 50 day SMA | 97.92 | 97.88 | 97.84 | | 100 day SMA | | 150 day SMA | | 200 day SMA |
|
|
