GoiTbill 182D200225_TB full analysis,charts,indicators,moving averages,SMA,DMA,EMA,ADX,MACD,RSIGoi Tbill 182D200225_TB WideScreen charts, DMA,SMA,EMA technical analysis, forecast prediction, by indicators ADX,MACD,RSI,CCI NSE stock exchange
Daily price and charts and targets GoiTbill Strong Daily Stock price targets for GoiTbill 182D200225_TB are 99.42 and 99.42 | Daily Target 1 | 99.42 | | Daily Target 2 | 99.42 | | Daily Target 3 | 99.42 | | Daily Target 4 | 99.42 | | Daily Target 5 | 99.42 |
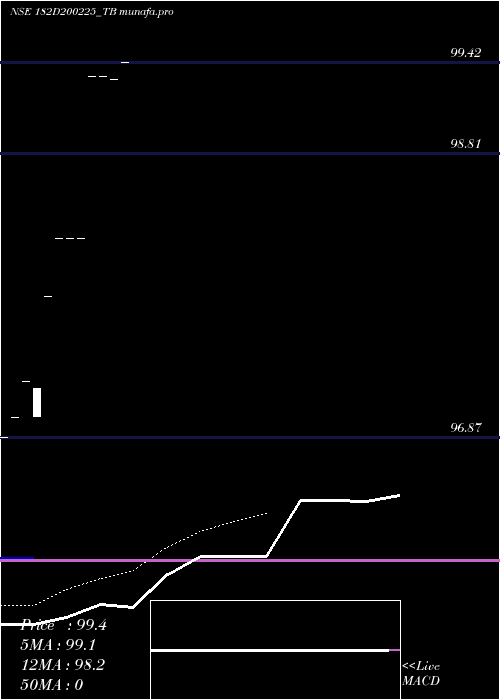
Daily price and volume Goi Tbill
| Date |
Closing |
Open |
Range |
Volume |
Thu 23 January 2025 |
99.42 (0.12%) |
99.42 |
99.42 - 99.42 |
0.2041 times |
Wed 22 January 2025 |
99.30 (-0.02%) |
99.30 |
99.30 - 99.30 |
0.102 times |
Tue 21 January 2025 |
99.32 (0%) |
99.32 |
99.32 - 99.32 |
0.102 times |
Mon 20 January 2025 |
99.32 (1.12%) |
99.32 |
99.32 - 99.32 |
0.102 times |
Fri 27 December 2024 |
98.22 (0%) |
98.22 |
98.22 - 98.22 |
0.102 times |
Fri 06 December 2024 |
98.22 (0%) |
98.22 |
98.22 - 98.22 |
0.102 times |
Thu 07 November 2024 |
98.22 (0.4%) |
98.22 |
98.22 - 98.22 |
3.0612 times |
Tue 08 October 2024 |
97.83 (0.65%) |
97.83 |
97.83 - 97.83 |
0.102 times |
Thu 03 October 2024 |
97.20 (-0.05%) |
97.02 |
97.02 - 97.20 |
1.1224 times |
Mon 30 September 2024 |
97.25 (0.25%) |
97.25 |
97.25 - 97.25 |
5 times |
Mon 09 September 2024 |
97.01 (0.14%) |
97.01 |
97.01 - 97.01 |
1.0204 times |
Weekly price and charts GoiTbill Strong weekly Stock price targets for GoiTbill 182D200225_TB are 99.36 and 99.48 | Weekly Target 1 | 99.26 | | Weekly Target 2 | 99.34 | | Weekly Target 3 | 99.38 | | Weekly Target 4 | 99.46 | | Weekly Target 5 | 99.5 |
Weekly price and volumes for Goi Tbill
| Date |
Closing |
Open |
Range |
Volume |
Thu 23 January 2025 |
99.42 (1.22%) |
99.32 |
99.30 - 99.42 |
0.2315 times |
Fri 27 December 2024 |
98.22 (0%) |
98.22 |
98.22 - 98.22 |
0.0463 times |
Fri 06 December 2024 |
98.22 (1.05%) |
97.83 |
97.83 - 98.22 |
1.4815 times |
Thu 03 October 2024 |
97.20 (0.2%) |
97.25 |
97.02 - 97.25 |
2.7778 times |
Mon 09 September 2024 |
97.01 (0%) |
97.01 |
97.01 - 97.01 |
0.463 times |
Mon 10 February 2025 |
(0%) |
|
- |
0 times |

Monthly price and charts GoiTbill Strong monthly Stock price targets for GoiTbill 182D200225_TB are 99.36 and 99.48 | Monthly Target 1 | 99.26 | | Monthly Target 2 | 99.34 | | Monthly Target 3 | 99.38 | | Monthly Target 4 | 99.46 | | Monthly Target 5 | 99.5 |
Monthly price and volumes Goi Tbill
| Date |
Closing |
Open |
Range |
Volume |
Thu 23 January 2025 |
99.42 (1.22%) |
99.32 |
99.30 - 99.42 |
0.2273 times |
Fri 27 December 2024 |
98.22 (0%) |
98.22 |
98.22 - 98.22 |
0.0909 times |
Thu 07 November 2024 |
98.22 (0.4%) |
98.22 |
98.22 - 98.22 |
1.3636 times |
Tue 08 October 2024 |
97.83 (0.6%) |
97.02 |
97.02 - 97.83 |
0.5455 times |
Mon 30 September 2024 |
97.25 (0.39%) |
97.01 |
97.01 - 97.25 |
2.6818 times |
Fri 30 August 2024 |
96.87 (0%) |
96.87 |
96.87 - 96.87 |
1.0909 times |
Mon 10 February 2025 |
(0%) |
|
- |
0 times |

DMA SMA EMA moving averages of Goi Tbill 182D200225_TB
DMA (daily moving average) of Goi Tbill 182D200225_TB
| DMA period | DMA value | | 5 day DMA | 99.12 | | 12 day DMA | | | 20 day DMA | | | 35 day DMA | | | 50 day DMA | | | 100 day DMA | | | 150 day DMA | | | 200 day DMA | | EMA (exponential moving average) of Goi Tbill 182D200225_TB
| EMA period | EMA current | EMA prev | EMA prev2 | | 5 day EMA | 99.07 | 98.9 | 98.7 | | 12 day EMA | 98.18 | | 20 day EMA | 0 | 0 | 0 | | 35 day EMA | 0 | 0 | 0 | | 50 day EMA | 0 | 0 | 0 |
SMA (simple moving average) of Goi Tbill 182D200225_TB
| SMA period | SMA current | SMA prev | SMA prev2 | | 5 day SMA | 99.12 | 98.88 | 98.66 | | 12 day SMA | | 20 day SMA | | 35 day SMA | | 50 day SMA | | 100 day SMA | | 150 day SMA | | 200 day SMA |
|
|
