GoiTbill 182D180925_TB full analysis,charts,indicators,moving averages,SMA,DMA,EMA,ADX,MACD,RSIGoi Tbill 182D180925_TB WideScreen charts, DMA,SMA,EMA technical analysis, forecast prediction, by indicators ADX,MACD,RSI,CCI NSE stock exchange
Daily price and charts and targets GoiTbill Strong Daily Stock price targets for GoiTbill 182D180925_TB are 98.5 and 98.5 | Daily Target 1 | 98.5 | | Daily Target 2 | 98.5 | | Daily Target 3 | 98.5 | | Daily Target 4 | 98.5 | | Daily Target 5 | 98.5 |
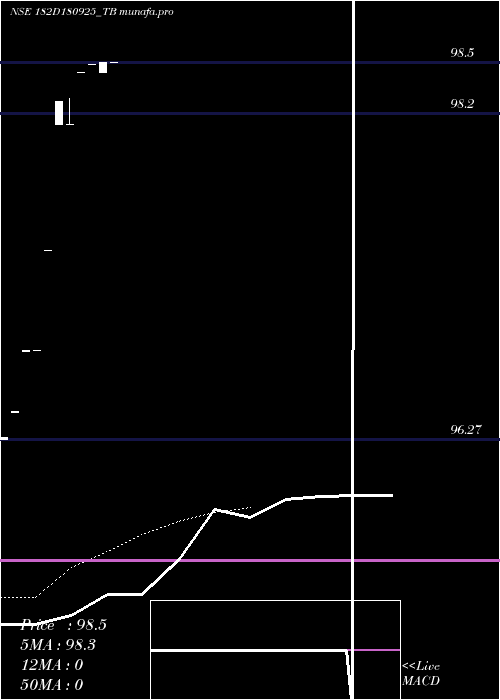
Daily price and volume Goi Tbill
| Date |
Closing |
Open |
Range |
Volume |
Wed 02 July 2025 |
98.50 (0%) |
98.50 |
98.50 - 98.50 |
0.2083 times |
Tue 01 July 2025 |
98.50 (0.01%) |
98.44 |
98.44 - 98.50 |
0.4167 times |
Mon 30 June 2025 |
98.49 (0.05%) |
98.49 |
98.49 - 98.49 |
0.2083 times |
Fri 27 June 2025 |
98.44 (0.32%) |
98.44 |
98.44 - 98.44 |
0.2083 times |
Wed 18 June 2025 |
98.13 (-0.14%) |
98.13 |
98.13 - 98.29 |
7.2917 times |
Tue 17 June 2025 |
98.27 (0.9%) |
98.13 |
98.13 - 98.27 |
0.4167 times |
Mon 05 May 2025 |
97.39 (0.61%) |
97.39 |
97.39 - 97.39 |
0.2083 times |
Fri 11 April 2025 |
96.80 (0%) |
96.80 |
96.80 - 96.80 |
0.2083 times |
Fri 04 April 2025 |
96.80 (0.37%) |
96.79 |
96.79 - 96.80 |
0.4167 times |
Wed 02 April 2025 |
96.44 (0.17%) |
96.43 |
96.43 - 96.44 |
0.4167 times |
Mon 24 March 2025 |
96.28 (0%) |
96.27 |
96.27 - 96.28 |
0.8333 times |
Weekly price and charts GoiTbill Strong weekly Stock price targets for GoiTbill 182D180925_TB are 98.47 and 98.53 | Weekly Target 1 | 98.42 | | Weekly Target 2 | 98.46 | | Weekly Target 3 | 98.48 | | Weekly Target 4 | 98.52 | | Weekly Target 5 | 98.54 |
Weekly price and volumes for Goi Tbill
| Date |
Closing |
Open |
Range |
Volume |
Wed 02 July 2025 |
98.50 (0.06%) |
98.49 |
98.44 - 98.50 |
0.3077 times |
Fri 27 June 2025 |
98.44 (1.69%) |
97.39 |
97.39 - 98.44 |
3 times |
Fri 11 April 2025 |
96.80 (0%) |
96.80 |
96.80 - 96.80 |
0.0769 times |
Fri 04 April 2025 |
96.80 (0%) |
96.27 |
96.27 - 96.80 |
0.6154 times |
Thu 03 July 2025 |
(0%) |
|
- |
0 times |

Monthly price and charts GoiTbill Strong monthly Stock price targets for GoiTbill 182D180925_TB are 98.47 and 98.53 | Monthly Target 1 | 98.42 | | Monthly Target 2 | 98.46 | | Monthly Target 3 | 98.48 | | Monthly Target 4 | 98.52 | | Monthly Target 5 | 98.54 |
Monthly price and volumes Goi Tbill
| Date |
Closing |
Open |
Range |
Volume |
Wed 02 July 2025 |
98.50 (0.01%) |
98.44 |
98.44 - 98.50 |
0.2885 times |
Mon 30 June 2025 |
98.49 (1.13%) |
98.13 |
98.13 - 98.49 |
3.75 times |
Mon 05 May 2025 |
97.39 (0.61%) |
97.39 |
97.39 - 97.39 |
0.0962 times |
Fri 11 April 2025 |
96.80 (0.54%) |
96.43 |
96.43 - 96.80 |
0.4808 times |
Mon 24 March 2025 |
96.28 (0%) |
96.27 |
96.27 - 96.28 |
0.3846 times |
Thu 03 July 2025 |
(0%) |
|
- |
0 times |

DMA SMA EMA moving averages of Goi Tbill 182D180925_TB
DMA (daily moving average) of Goi Tbill 182D180925_TB
| DMA period | DMA value | | 5 day DMA | 98.41 | | 12 day DMA | | | 20 day DMA | | | 35 day DMA | | | 50 day DMA | | | 100 day DMA | | | 150 day DMA | | | 200 day DMA | | EMA (exponential moving average) of Goi Tbill 182D180925_TB
| EMA period | EMA current | EMA prev | EMA prev2 | | 5 day EMA | 98.31 | 98.21 | 98.06 | | 12 day EMA | 0 | 0 | 0 | | 20 day EMA | 0 | 0 | 0 | | 35 day EMA | 0 | 0 | 0 | | 50 day EMA | 0 | 0 | 0 |
SMA (simple moving average) of Goi Tbill 182D180925_TB
| SMA period | SMA current | SMA prev | SMA prev2 | | 5 day SMA | 98.41 | 98.37 | 98.14 | | 12 day SMA | | 20 day SMA | | 35 day SMA | | 50 day SMA | | 100 day SMA | | 150 day SMA | | 200 day SMA |
|
|
