GoiTbill 182D120226_TB full analysis,charts,indicators,moving averages,SMA,DMA,EMA,ADX,MACD,RSIGoi Tbill 182D120226_TB WideScreen charts, DMA,SMA,EMA technical analysis, forecast prediction, by indicators ADX,MACD,RSI,CCI NSE stock exchange
Daily price and charts and targets GoiTbill Strong Daily Stock price targets for GoiTbill 182D120226_TB are 98.4 and 98.4 | Daily Target 1 | 98.4 | | Daily Target 2 | 98.4 | | Daily Target 3 | 98.4 | | Daily Target 4 | 98.4 | | Daily Target 5 | 98.4 |
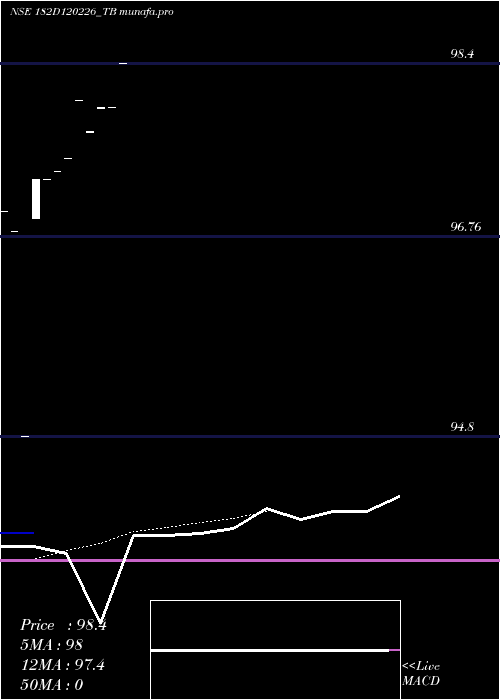
Daily price and volume Goi Tbill
| Date |
Closing |
Open |
Range |
Volume |
Fri 14 November 2025 |
98.40 (0.43%) |
98.40 |
98.40 - 98.40 |
0.5263 times |
Tue 04 November 2025 |
97.98 (0%) |
97.98 |
97.98 - 97.98 |
2.6316 times |
Tue 28 October 2025 |
97.98 (0.24%) |
97.97 |
97.97 - 97.98 |
1.0526 times |
Wed 15 October 2025 |
97.75 (-0.31%) |
97.74 |
97.74 - 97.75 |
1.0526 times |
Mon 13 October 2025 |
98.05 (0.56%) |
98.05 |
98.05 - 98.05 |
0.5263 times |
Fri 26 September 2025 |
97.50 (0.13%) |
97.50 |
97.50 - 97.50 |
1.5789 times |
Thu 25 September 2025 |
97.37 (0.07%) |
97.37 |
97.37 - 97.37 |
0.5263 times |
Tue 16 September 2025 |
97.30 (0%) |
97.30 |
97.30 - 97.30 |
0.5263 times |
Mon 25 August 2025 |
97.30 (2.57%) |
96.93 |
96.93 - 97.30 |
1.0526 times |
Wed 20 August 2025 |
94.86 (-2%) |
94.86 |
94.86 - 94.86 |
0.5263 times |
Tue 19 August 2025 |
96.80 (-0.21%) |
96.80 |
96.80 - 96.80 |
0.5263 times |
Weekly price and charts GoiTbill Strong weekly Stock price targets for GoiTbill 182D120226_TB are 98.19 and 98.61 | Weekly Target 1 | 97.84 | | Weekly Target 2 | 98.12 | | Weekly Target 3 | 98.26 | | Weekly Target 4 | 98.54 | | Weekly Target 5 | 98.68 |
Weekly price and volumes for Goi Tbill
| Date |
Closing |
Open |
Range |
Volume |
Fri 14 November 2025 |
98.40 (0.43%) |
97.98 |
97.98 - 98.40 |
1.0714 times |
Tue 28 October 2025 |
97.98 (0.24%) |
97.97 |
97.97 - 97.98 |
0.3571 times |
Wed 15 October 2025 |
97.75 (0.26%) |
98.05 |
97.74 - 98.05 |
0.5357 times |
Fri 26 September 2025 |
97.50 (2.78%) |
96.93 |
96.93 - 97.50 |
1.25 times |
Wed 20 August 2025 |
94.86 (0%) |
97.00 |
94.86 - 97.00 |
1.7857 times |
Mon 17 November 2025 |
(0%) |
|
- |
0 times |

Monthly price and charts GoiTbill Strong monthly Stock price targets for GoiTbill 182D120226_TB are 98.19 and 98.61 | Monthly Target 1 | 97.84 | | Monthly Target 2 | 98.12 | | Monthly Target 3 | 98.26 | | Monthly Target 4 | 98.54 | | Monthly Target 5 | 98.68 |
Monthly price and volumes Goi Tbill
| Date |
Closing |
Open |
Range |
Volume |
Fri 14 November 2025 |
98.40 (0.43%) |
97.98 |
97.98 - 98.40 |
0.8571 times |
Tue 28 October 2025 |
97.98 (0.49%) |
98.05 |
97.74 - 98.05 |
0.7143 times |
Fri 26 September 2025 |
97.50 (0.21%) |
97.30 |
97.30 - 97.50 |
0.7143 times |
Mon 25 August 2025 |
97.30 (0%) |
97.00 |
94.86 - 97.30 |
1.7143 times |
Mon 17 November 2025 |
(0%) |
|
- |
0 times |

DMA SMA EMA moving averages of Goi Tbill 182D120226_TB
DMA (daily moving average) of Goi Tbill 182D120226_TB
| DMA period | DMA value | | 5 day DMA | 98.03 | | 12 day DMA | | | 20 day DMA | | | 35 day DMA | | | 50 day DMA | | | 100 day DMA | | | 150 day DMA | | | 200 day DMA | | EMA (exponential moving average) of Goi Tbill 182D120226_TB
| EMA period | EMA current | EMA prev | EMA prev2 | | 5 day EMA | 97.98 | 97.77 | 97.67 | | 12 day EMA | 97.36 | | 20 day EMA | 0 | 0 | 0 | | 35 day EMA | 0 | 0 | 0 | | 50 day EMA | 0 | 0 | 0 |
SMA (simple moving average) of Goi Tbill 182D120226_TB
| SMA period | SMA current | SMA prev | SMA prev2 | | 5 day SMA | 98.03 | 97.85 | 97.73 | | 12 day SMA | | 20 day SMA | | 35 day SMA | | 50 day SMA | | 100 day SMA | | 150 day SMA | | 200 day SMA |
|
|
