GoiTbill 182D040425_TB full analysis,charts,indicators,moving averages,SMA,DMA,EMA,ADX,MACD,RSIGoi Tbill 182D040425_TB WideScreen charts, DMA,SMA,EMA technical analysis, forecast prediction, by indicators ADX,MACD,RSI,CCI NSE stock exchange
Daily price and charts and targets GoiTbill Strong Daily Stock price targets for GoiTbill 182D040425_TB are 98.62 and 98.69 | Daily Target 1 | 98.6 | | Daily Target 2 | 98.63 | | Daily Target 3 | 98.673333333333 | | Daily Target 4 | 98.7 | | Daily Target 5 | 98.74 |
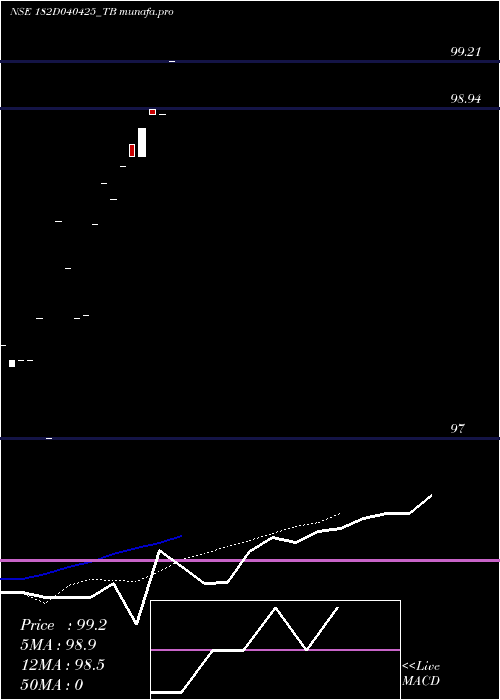
Daily price and volume Goi Tbill
| Date |
Closing |
Open |
Range |
Volume |
Tue 28 January 2025 |
98.65 (0.05%) |
98.72 |
98.65 - 98.72 |
0.7143 times |
Thu 23 January 2025 |
98.60 (0.2%) |
98.60 |
98.60 - 98.60 |
0.1786 times |
Wed 15 January 2025 |
98.40 (-0.1%) |
98.40 |
98.40 - 98.40 |
0.1786 times |
Fri 10 January 2025 |
98.50 (0.25%) |
98.50 |
98.50 - 98.50 |
0.1786 times |
Thu 02 January 2025 |
98.25 (0.54%) |
98.25 |
98.25 - 98.25 |
0.1786 times |
Wed 01 January 2025 |
97.72 (0.02%) |
97.72 |
97.72 - 97.72 |
0.7143 times |
Tue 31 December 2024 |
97.70 (-0.31%) |
97.70 |
97.70 - 97.70 |
0.1786 times |
Mon 30 December 2024 |
98.00 (-0.27%) |
98.00 |
98.00 - 98.00 |
0.1786 times |
Thu 26 December 2024 |
98.27 (1.31%) |
98.27 |
98.27 - 98.27 |
7.3214 times |
Wed 18 December 2024 |
97.00 (-0.72%) |
97.00 |
97.00 - 97.00 |
0.1786 times |
Wed 27 November 2024 |
97.70 (0.25%) |
97.70 |
97.70 - 97.70 |
5.3571 times |
Weekly price and charts GoiTbill Strong weekly Stock price targets for GoiTbill 182D040425_TB are 98.62 and 98.69 | Weekly Target 1 | 98.6 | | Weekly Target 2 | 98.63 | | Weekly Target 3 | 98.673333333333 | | Weekly Target 4 | 98.7 | | Weekly Target 5 | 98.74 |
Weekly price and volumes for Goi Tbill
| Date |
Closing |
Open |
Range |
Volume |
Tue 28 January 2025 |
98.65 (0.05%) |
98.72 |
98.65 - 98.72 |
0.2581 times |
Thu 23 January 2025 |
98.60 (0.1%) |
98.40 |
98.40 - 98.60 |
0.129 times |
Fri 10 January 2025 |
98.50 (0.23%) |
98.00 |
97.70 - 98.50 |
0.5161 times |
Thu 26 December 2024 |
98.27 (0.58%) |
97.00 |
97.00 - 98.27 |
2.7097 times |
Wed 27 November 2024 |
97.70 (0.25%) |
97.46 |
97.46 - 97.70 |
2.0645 times |
Fri 22 November 2024 |
97.46 (0%) |
97.55 |
97.42 - 97.55 |
0.3226 times |
Wed 05 February 2025 |
(0%) |
|
- |
0 times |

Monthly price and charts GoiTbill Strong monthly Stock price targets for GoiTbill 182D040425_TB are 98.19 and 99.19 | Monthly Target 1 | 97.36 | | Monthly Target 2 | 98.01 | | Monthly Target 3 | 98.363333333333 | | Monthly Target 4 | 99.01 | | Monthly Target 5 | 99.36 |
Monthly price and volumes Goi Tbill
| Date |
Closing |
Open |
Range |
Volume |
Tue 28 January 2025 |
98.65 (0.97%) |
97.72 |
97.72 - 98.72 |
0.3871 times |
Tue 31 December 2024 |
97.70 (0%) |
97.00 |
97.00 - 98.27 |
1.4194 times |
Wed 27 November 2024 |
97.70 (0%) |
97.55 |
97.42 - 97.70 |
1.1935 times |
Wed 05 February 2025 |
(0%) |
|
- |
0 times |

DMA SMA EMA moving averages of Goi Tbill 182D040425_TB
DMA (daily moving average) of Goi Tbill 182D040425_TB
| DMA period | DMA value | | 5 day DMA | 98.48 | | 12 day DMA | 98.02 | | 20 day DMA | | | 35 day DMA | | | 50 day DMA | | | 100 day DMA | | | 150 day DMA | | | 200 day DMA | | EMA (exponential moving average) of Goi Tbill 182D040425_TB
| EMA period | EMA current | EMA prev | EMA prev2 | | 5 day EMA | 98.44 | 98.34 | 98.21 | | 12 day EMA | 98.07 | 97.97 | 97.86 | | 20 day EMA | 0 | 0 | 0 | | 35 day EMA | 0 | 0 | 0 | | 50 day EMA | 0 | 0 | 0 |
SMA (simple moving average) of Goi Tbill 182D040425_TB
| SMA period | SMA current | SMA prev | SMA prev2 | | 5 day SMA | 98.48 | 98.29 | 98.11 | | 12 day SMA | 98.02 | 97.92 | | 20 day SMA | | 35 day SMA | | 50 day SMA | | 100 day SMA | | 150 day SMA | | 200 day SMA |
|
|
