SecRed 1050UCL25_N7 full analysis,charts,indicators,moving averages,SMA,DMA,EMA,ADX,MACD,RSISec Red 1050UCL25_N7 WideScreen charts, DMA,SMA,EMA technical analysis, forecast prediction, by indicators ADX,MACD,RSI,CCI NSE stock exchange
Daily price and charts and targets SecRed Strong Daily Stock price targets for SecRed 1050UCL25_N7 are 1006 and 1006 | Daily Target 1 | 1006 | | Daily Target 2 | 1006 | | Daily Target 3 | 1006 | | Daily Target 4 | 1006 | | Daily Target 5 | 1006 |
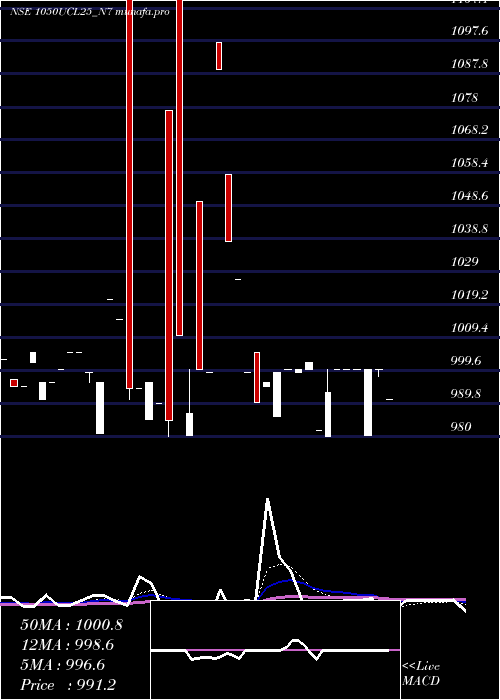
Daily price and volume Sec Red
| Date |
Closing |
Open |
Range |
Volume |
Wed 02 July 2025 |
1006.00 (0.57%) |
1006.00 |
1006.00 - 1006.00 |
0.0081 times |
Tue 01 July 2025 |
1000.25 (-0.44%) |
1000.25 |
1000.25 - 1000.25 |
0.061 times |
Mon 30 June 2025 |
1004.70 (1.48%) |
1005.00 |
1004.70 - 1005.00 |
1.4199 times |
Fri 27 June 2025 |
990.00 (1.01%) |
990.00 |
990.00 - 990.00 |
0.7771 times |
Thu 26 June 2025 |
980.10 (-1.94%) |
1000.00 |
980.10 - 1000.00 |
0.8137 times |
Wed 25 June 2025 |
999.50 (-0.05%) |
971.18 |
971.18 - 1000.00 |
1.5012 times |
Tue 24 June 2025 |
1000.00 (0.91%) |
1000.00 |
999.99 - 1000.00 |
0.7852 times |
Mon 23 June 2025 |
991.00 (0.1%) |
991.00 |
991.00 - 991.00 |
2.9292 times |
Thu 12 June 2025 |
990.00 (-1%) |
995.00 |
990.00 - 995.00 |
1.2205 times |
Wed 04 June 2025 |
1000.00 (0.1%) |
999.00 |
995.55 - 1000.00 |
0.4841 times |
Thu 29 May 2025 |
999.00 (-0.1%) |
1000.00 |
999.00 - 1010.00 |
0.2034 times |
Weekly price and charts SecRed Strong weekly Stock price targets for SecRed 1050UCL25_N7 are 1003.13 and 1008.88 | Weekly Target 1 | 998.33 | | Weekly Target 2 | 1002.17 | | Weekly Target 3 | 1004.0833333333 | | Weekly Target 4 | 1007.92 | | Weekly Target 5 | 1009.83 |
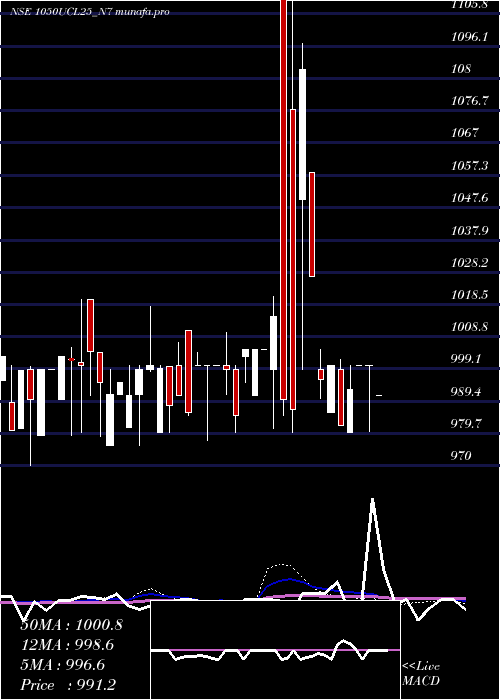
Weekly price and volumes for Sec Red
| Date |
Closing |
Open |
Range |
Volume |
Wed 02 July 2025 |
1006.00 (1.62%) |
1005.00 |
1000.25 - 1006.00 |
0.6931 times |
Fri 27 June 2025 |
990.00 (0%) |
991.00 |
971.18 - 1000.00 |
3.168 times |
Thu 12 June 2025 |
990.00 (-0.9%) |
999.00 |
990.00 - 1000.00 |
0.7934 times |
Thu 29 May 2025 |
999.00 (0%) |
999.00 |
999.00 - 1010.00 |
2.1435 times |
Fri 23 May 2025 |
999.00 (-0.1%) |
1000.00 |
998.00 - 1000.00 |
0.7612 times |
Fri 16 May 2025 |
1000.00 (0.89%) |
992.00 |
991.00 - 1003.99 |
0.161 times |
Tue 06 May 2025 |
991.20 (-0.88%) |
991.20 |
991.20 - 991.20 |
0.1704 times |
Fri 02 May 2025 |
1000.00 (0%) |
1000.00 |
980.41 - 1000.00 |
2.0053 times |
Fri 25 April 2025 |
1000.00 (0.7%) |
1000.00 |
1000.00 - 1000.00 |
0.0644 times |
Thu 17 April 2025 |
993.00 (1.12%) |
980.10 |
980.10 - 1000.00 |
0.0398 times |
Fri 11 April 2025 |
982.00 (-1.8%) |
999.00 |
982.00 - 1002.00 |
0.3977 times |
Monthly price and charts SecRed Strong monthly Stock price targets for SecRed 1050UCL25_N7 are 1003.13 and 1008.88 | Monthly Target 1 | 998.33 | | Monthly Target 2 | 1002.17 | | Monthly Target 3 | 1004.0833333333 | | Monthly Target 4 | 1007.92 | | Monthly Target 5 | 1009.83 |
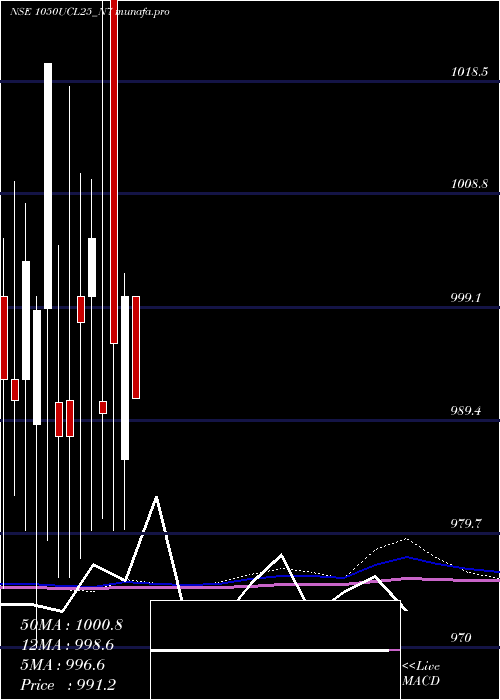
Monthly price and volumes Sec Red
| Date |
Closing |
Open |
Range |
Volume |
Wed 02 July 2025 |
1006.00 (0.13%) |
1000.25 |
1000.25 - 1006.00 |
0.0113 times |
Mon 30 June 2025 |
1004.70 (0.57%) |
999.00 |
971.18 - 1005.00 |
1.6248 times |
Thu 29 May 2025 |
999.00 (-0.1%) |
1000.00 |
991.00 - 1010.00 |
1.517 times |
Wed 30 April 2025 |
1000.00 (0.4%) |
986.00 |
980.10 - 1002.00 |
1.1363 times |
Fri 28 March 2025 |
996.00 (0.61%) |
1077.00 |
980.00 - 1139.00 |
0.406 times |
Fri 28 February 2025 |
990.01 (-1.49%) |
991.00 |
981.00 - 1199.00 |
0.5079 times |
Fri 31 January 2025 |
1005.00 (0.73%) |
1000.00 |
980.00 - 1010.00 |
1.0404 times |
Tue 24 December 2024 |
997.75 (0.99%) |
1000.00 |
977.55 - 1010.50 |
0.5026 times |
Fri 29 November 2024 |
988.00 (0%) |
991.10 |
976.00 - 1018.00 |
2.383 times |
Thu 31 October 2024 |
988.00 (-3.14%) |
990.99 |
976.00 - 1004.40 |
0.8707 times |
Mon 30 September 2024 |
1020.00 (2.12%) |
999.00 |
979.13 - 1020.00 |
1.1316 times |
DMA SMA EMA moving averages of Sec Red 1050UCL25_N7
DMA (daily moving average) of Sec Red 1050UCL25_N7
| DMA period | DMA value | | 5 day DMA | 996.21 | | 12 day DMA | 996.71 | | 20 day DMA | 998.13 | | 35 day DMA | 997.34 | | 50 day DMA | 1001.02 | | 100 day DMA | 999.35 | | 150 day DMA | 997.63 | | 200 day DMA | | EMA (exponential moving average) of Sec Red 1050UCL25_N7
| EMA period | EMA current | EMA prev | EMA prev2 | | 5 day EMA | 1000.12 | 997.18 | 995.64 | | 12 day EMA | 997.98 | 996.52 | 995.84 | | 20 day EMA | 997.89 | 997.04 | 996.7 | | 35 day EMA | 999.37 | 998.98 | 998.91 | | 50 day EMA | 1000.62 | 1000.4 | 1000.41 |
SMA (simple moving average) of Sec Red 1050UCL25_N7
| SMA period | SMA current | SMA prev | SMA prev2 | | 5 day SMA | 996.21 | 994.91 | 994.86 | | 12 day SMA | 996.71 | 996.21 | 996.11 | | 20 day SMA | 998.13 | 997.38 | 996.92 | | 35 day SMA | 997.34 | 997.14 | 997.9 | | 50 day SMA | 1001.02 | 1000.82 | 1000.8 | | 100 day SMA | 999.35 | 999.2 | 999.08 | | 150 day SMA | 997.63 | 997.52 | 997.39 | | 200 day SMA |
|
|
