SecRe 1025NFL25_N5 full analysis,charts,indicators,moving averages,SMA,DMA,EMA,ADX,MACD,RSISec Re 1025NFL25_N5 WideScreen charts, DMA,SMA,EMA technical analysis, forecast prediction, by indicators ADX,MACD,RSI,CCI NSE stock exchange
Daily price and charts and targets SecRe Strong Daily Stock price targets for SecRe 1025NFL25_N5 are 988.32 and 996.11 | Daily Target 1 | 987.02 | | Daily Target 2 | 989.61 | | Daily Target 3 | 994.80666666667 | | Daily Target 4 | 997.4 | | Daily Target 5 | 1002.6 |
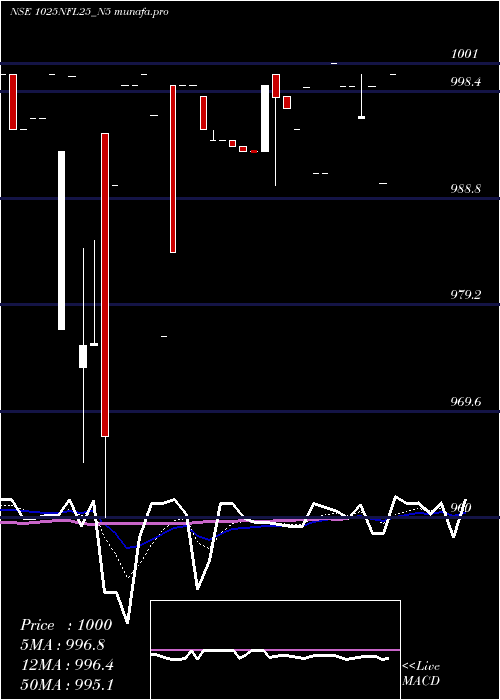
Daily price and volume Sec Re
| Date |
Closing |
Open |
Range |
Volume |
Fri 09 May 2025 |
992.21 (-0.78%) |
1000.00 |
992.21 - 1000.00 |
0.5691 times |
Thu 08 May 2025 |
1000.00 (0%) |
1000.00 |
1000.00 - 1000.00 |
0.1355 times |
Wed 30 April 2025 |
1000.00 (-1.77%) |
1000.00 |
1000.00 - 1000.00 |
0.0271 times |
Mon 28 April 2025 |
1018.00 (2%) |
998.05 |
998.05 - 1018.00 |
0.542 times |
Fri 25 April 2025 |
998.05 (0%) |
998.05 |
998.05 - 998.05 |
0.542 times |
Tue 22 April 2025 |
998.05 (0%) |
998.25 |
998.05 - 998.25 |
0.9756 times |
Mon 21 April 2025 |
998.04 (-0.1%) |
1001.50 |
998.00 - 1002.00 |
3.9295 times |
Wed 09 April 2025 |
999.00 (-0.6%) |
999.00 |
999.00 - 999.00 |
1.084 times |
Tue 08 April 2025 |
1005.00 (2.03%) |
987.00 |
987.00 - 1005.00 |
1.1111 times |
Mon 07 April 2025 |
985.00 (-0%) |
985.00 |
985.00 - 985.00 |
1.084 times |
Fri 04 April 2025 |
985.01 (-0.61%) |
998.00 |
985.01 - 998.00 |
3.252 times |
Weekly price and charts SecRe Strong weekly Stock price targets for SecRe 1025NFL25_N5 are 979.32 and 1005.11 | Weekly Target 1 | 975.02 | | Weekly Target 2 | 983.61 | | Weekly Target 3 | 1000.8066666667 | | Weekly Target 4 | 1009.4 | | Weekly Target 5 | 1026.6 |
Weekly price and volumes for Sec Re
| Date |
Closing |
Open |
Range |
Volume |
Fri 09 May 2025 |
992.21 (-0.59%) |
998.05 |
992.21 - 1018.00 |
0.2485 times |
Fri 25 April 2025 |
998.05 (-0.1%) |
1001.50 |
998.00 - 1002.00 |
1.0629 times |
Wed 09 April 2025 |
999.00 (1.42%) |
985.00 |
985.00 - 1005.00 |
0.6399 times |
Fri 04 April 2025 |
985.01 (-1.4%) |
991.01 |
985.01 - 998.00 |
0.6875 times |
Wed 26 March 2025 |
999.00 (-0.1%) |
1000.00 |
966.00 - 1001.25 |
2.6177 times |
Fri 21 March 2025 |
1000.00 (-0.3%) |
1000.00 |
990.00 - 1000.00 |
3.3739 times |
Wed 12 March 2025 |
1003.00 (0.5%) |
1003.00 |
1003.00 - 1003.00 |
0.0529 times |
Wed 05 March 2025 |
998.01 (-0.5%) |
1000.00 |
998.01 - 1000.00 |
0.0793 times |
Fri 28 February 2025 |
1003.00 (1.29%) |
1000.00 |
1000.00 - 1003.00 |
0.661 times |
Wed 29 January 2025 |
990.20 (-0.87%) |
990.20 |
990.20 - 990.20 |
0.5764 times |
Wed 22 January 2025 |
998.90 (0.27%) |
998.90 |
998.90 - 998.90 |
1.5865 times |

Monthly price and charts SecRe Strong monthly Stock price targets for SecRe 1025NFL25_N5 are 988.32 and 996.11 | Monthly Target 1 | 987.02 | | Monthly Target 2 | 989.61 | | Monthly Target 3 | 994.80666666667 | | Monthly Target 4 | 997.4 | | Monthly Target 5 | 1002.6 |
Monthly price and volumes Sec Re
| Date |
Closing |
Open |
Range |
Volume |
Fri 09 May 2025 |
992.21 (-0.78%) |
1000.00 |
992.21 - 1000.00 |
0.0277 times |
Wed 30 April 2025 |
1000.00 (0.1%) |
991.01 |
985.00 - 1018.00 |
0.5035 times |
Wed 26 March 2025 |
999.00 (-0.4%) |
1000.00 |
966.00 - 1003.00 |
1.2326 times |
Fri 28 February 2025 |
1003.00 (1.29%) |
1000.00 |
1000.00 - 1003.00 |
0.133 times |
Wed 29 January 2025 |
990.20 (-0.09%) |
991.08 |
990.20 - 1001.00 |
0.6354 times |
Tue 31 December 2024 |
991.08 (-0.2%) |
993.02 |
990.00 - 1000.00 |
2.3449 times |
Fri 29 November 2024 |
993.02 (-0.7%) |
996.30 |
976.40 - 999.00 |
2.4992 times |
Thu 31 October 2024 |
1000.00 (0.7%) |
999.80 |
960.00 - 1000.00 |
1.3795 times |
Mon 23 September 2024 |
993.00 (-0.5%) |
1000.00 |
977.01 - 1000.00 |
0.7131 times |
Thu 29 August 2024 |
998.00 (-0.2%) |
1000.00 |
971.00 - 1005.00 |
0.5311 times |
Mon 29 July 2024 |
1000.00 (1.01%) |
994.00 |
955.10 - 1000.00 |
0.5162 times |

DMA SMA EMA moving averages of Sec Re 1025NFL25_N5
DMA (daily moving average) of Sec Re 1025NFL25_N5
| DMA period | DMA value | | 5 day DMA | 1001.65 | | 12 day DMA | 997.45 | | 20 day DMA | 998.18 | | 35 day DMA | 997.93 | | 50 day DMA | 996.78 | | 100 day DMA | 995.42 | | 150 day DMA | | | 200 day DMA | | EMA (exponential moving average) of Sec Re 1025NFL25_N5
| EMA period | EMA current | EMA prev | EMA prev2 | | 5 day EMA | 998.7 | 1001.95 | 1002.93 | | 12 day EMA | 998.96 | 1000.19 | 1000.23 | | 20 day EMA | 998.45 | 999.11 | 999.02 | | 35 day EMA | 997.18 | 997.47 | 997.32 | | 50 day EMA | 996.35 | 996.52 | 996.38 |
SMA (simple moving average) of Sec Re 1025NFL25_N5
| SMA period | SMA current | SMA prev | SMA prev2 | | 5 day SMA | 1001.65 | 1002.82 | 1002.43 | | 12 day SMA | 997.45 | 998.01 | 998.12 | | 20 day SMA | 998.18 | 998.72 | 998.62 | | 35 day SMA | 997.93 | 998.07 | 998.01 | | 50 day SMA | 996.78 | 996.91 | 996.89 | | 100 day SMA | 995.42 | 995.4 | | 150 day SMA | | 200 day SMA |
|
|
