ZynexInc ZYXI full analysis,charts,indicators,moving averages,SMA,DMA,EMA,ADX,MACD,RSIZynex Inc ZYXI WideScreen charts, DMA,SMA,EMA technical analysis, forecast prediction, by indicators ADX,MACD,RSI,CCI NASDAQ stock exchange
operates under Health Care sector & deals in Biotechnology Electromedical Electrotherapeutic Apparatus
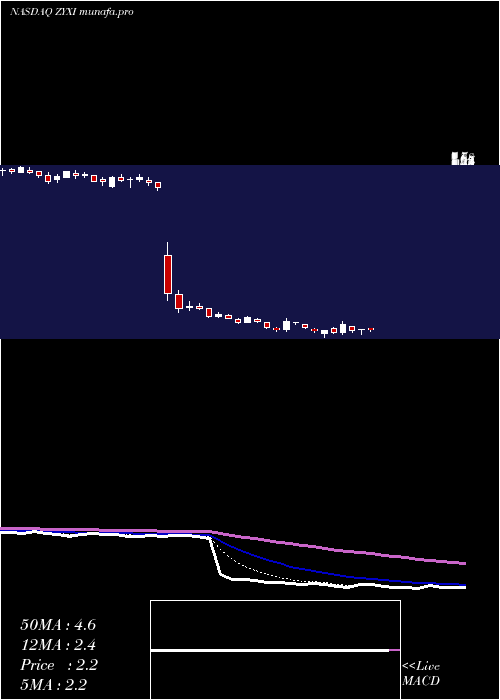
Daily price and charts and targets ZynexInc Strong Daily Stock price targets for ZynexInc ZYXI are 0.25 and 0.32 | Daily Target 1 | 0.2 | | Daily Target 2 | 0.23 | | Daily Target 3 | 0.26666666666667 | | Daily Target 4 | 0.3 | | Daily Target 5 | 0.34 |
Daily price and volume Zynex Inc
| Date |
Closing |
Open |
Range |
Volume |
Thu 18 December 2025 |
0.27 (3.85%) |
0.25 |
0.23 - 0.30 |
1.0318 times |
Wed 17 December 2025 |
0.26 (-23.53%) |
0.32 |
0.23 - 0.36 |
2.0759 times |
Tue 16 December 2025 |
0.34 (-48.48%) |
0.34 |
0.27 - 0.40 |
4.4816 times |
Mon 15 December 2025 |
0.66 (-10.81%) |
0.73 |
0.65 - 0.77 |
0.2653 times |
Fri 12 December 2025 |
0.74 (-13.95%) |
0.88 |
0.74 - 0.88 |
0.3798 times |
Thu 11 December 2025 |
0.86 (-1.15%) |
0.87 |
0.78 - 0.90 |
0.2103 times |
Wed 10 December 2025 |
0.87 (2.35%) |
0.89 |
0.83 - 0.95 |
0.4809 times |
Tue 09 December 2025 |
0.85 (4.94%) |
0.79 |
0.75 - 0.86 |
0.338 times |
Mon 08 December 2025 |
0.81 (-8.99%) |
0.89 |
0.78 - 0.95 |
0.3738 times |
Fri 05 December 2025 |
0.89 (-12.75%) |
1.07 |
0.84 - 1.11 |
0.3626 times |
Thu 04 December 2025 |
1.02 (-12.07%) |
1.16 |
1.00 - 1.18 |
0.5049 times |
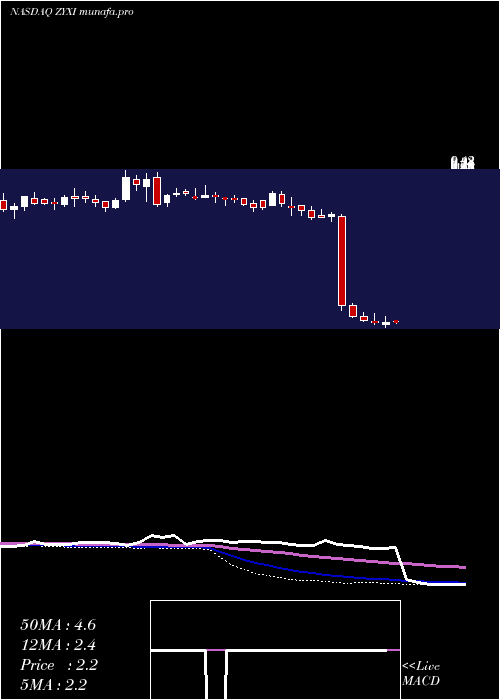
Weekly price and charts ZynexInc Strong weekly Stock price targets for ZynexInc ZYXI are -0.02 and 0.52 | Weekly Target 1 | -0.12 | | Weekly Target 2 | 0.08 | | Weekly Target 3 | 0.42333333333333 | | Weekly Target 4 | 0.62 | | Weekly Target 5 | 0.96 |
Weekly price and volumes for Zynex Inc
| Date |
Closing |
Open |
Range |
Volume |
Thu 18 December 2025 |
0.27 (-63.51%) |
0.73 |
0.23 - 0.77 |
0.5378 times |
Fri 12 December 2025 |
0.74 (-16.85%) |
0.89 |
0.74 - 0.95 |
0.1221 times |
Fri 05 December 2025 |
0.89 (-29.37%) |
1.21 |
0.84 - 1.50 |
0.3906 times |
Fri 28 November 2025 |
1.26 (103.23%) |
0.62 |
0.60 - 2.10 |
5.0191 times |
Fri 21 November 2025 |
0.62 (8.77%) |
0.61 |
0.38 - 0.74 |
3.7863 times |
Fri 14 November 2025 |
0.57 (-45.19%) |
1.03 |
0.51 - 1.20 |
0.0937 times |
Fri 07 November 2025 |
1.04 (-9.57%) |
1.13 |
1.03 - 1.19 |
0.014 times |
Fri 31 October 2025 |
1.15 (0%) |
1.21 |
1.13 - 1.23 |
0.0054 times |
Fri 31 October 2025 |
1.15 (-17.86%) |
1.39 |
1.13 - 1.42 |
0.0162 times |
Fri 24 October 2025 |
1.40 (5.26%) |
1.34 |
1.32 - 1.47 |
0.0149 times |
Fri 17 October 2025 |
1.33 (-3.62%) |
1.41 |
1.30 - 1.43 |
0.0093 times |
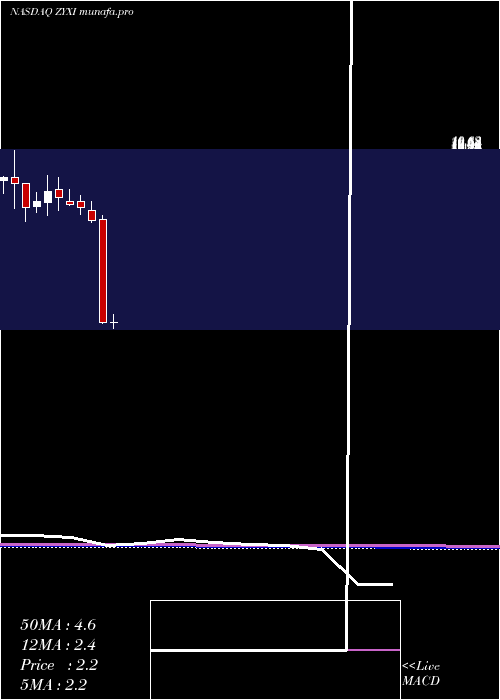
Monthly price and charts ZynexInc Strong monthly Stock price targets for ZynexInc ZYXI are -0.39 and 0.89 | Monthly Target 1 | -0.6 | | Monthly Target 2 | -0.17 | | Monthly Target 3 | 0.66666666666667 | | Monthly Target 4 | 1.1 | | Monthly Target 5 | 1.94 |
Monthly price and volumes Zynex Inc
| Date |
Closing |
Open |
Range |
Volume |
Thu 18 December 2025 |
0.27 (-78.57%) |
1.21 |
0.23 - 1.50 |
0.9382 times |
Fri 28 November 2025 |
1.26 (9.57%) |
1.13 |
0.38 - 2.10 |
7.9608 times |
Fri 31 October 2025 |
1.15 (-20.69%) |
1.42 |
1.13 - 1.52 |
0.0589 times |
Tue 30 September 2025 |
1.45 (-11.59%) |
1.61 |
1.41 - 1.68 |
0.0594 times |
Fri 29 August 2025 |
1.64 (-26.46%) |
2.11 |
1.23 - 2.11 |
0.1687 times |
Thu 31 July 2025 |
2.23 (-13.57%) |
2.58 |
2.05 - 2.82 |
0.0887 times |
Mon 30 June 2025 |
2.58 (10.26%) |
2.35 |
1.99 - 2.82 |
0.1675 times |
Fri 30 May 2025 |
2.34 (40.96%) |
1.75 |
1.70 - 2.66 |
0.1189 times |
Wed 30 April 2025 |
1.66 (-24.55%) |
2.18 |
1.66 - 2.58 |
0.1458 times |
Mon 31 March 2025 |
2.20 (-69.49%) |
7.26 |
2.14 - 7.43 |
0.293 times |
Fri 28 February 2025 |
7.21 (-8.04%) |
7.72 |
7.12 - 8.13 |
0.0459 times |
DMA SMA EMA moving averages of Zynex Inc ZYXI
DMA (daily moving average) of Zynex Inc ZYXI
| DMA period | DMA value | | 5 day DMA | 0.45 | | 12 day DMA | 0.73 | | 20 day DMA | 0.83 | | 35 day DMA | 0.88 | | 50 day DMA | 1.03 | | 100 day DMA | 1.29 | | 150 day DMA | 1.65 | | 200 day DMA | 1.94 | EMA (exponential moving average) of Zynex Inc ZYXI
| EMA period | EMA current | EMA prev | EMA prev2 | | 5 day EMA | 0.43 | 0.51 | 0.63 | | 12 day EMA | 0.64 | 0.71 | 0.79 | | 20 day EMA | 0.75 | 0.8 | 0.86 | | 35 day EMA | 0.91 | 0.95 | 0.99 | | 50 day EMA | 1 | 1.03 | 1.06 |
SMA (simple moving average) of Zynex Inc ZYXI
| SMA period | SMA current | SMA prev | SMA prev2 | | 5 day SMA | 0.45 | 0.57 | 0.69 | | 12 day SMA | 0.73 | 0.8 | 0.89 | | 20 day SMA | 0.83 | 0.84 | 0.85 | | 35 day SMA | 0.88 | 0.91 | 0.94 | | 50 day SMA | 1.03 | 1.05 | 1.08 | | 100 day SMA | 1.29 | 1.31 | 1.34 | | 150 day SMA | 1.65 | 1.66 | 1.67 | | 200 day SMA | 1.94 | 1.97 | 2.01 |
|
|
