VastaPlatform VSTA full analysis,charts,indicators,moving averages,SMA,DMA,EMA,ADX,MACD,RSIVasta Platform VSTA WideScreen charts, DMA,SMA,EMA technical analysis, forecast prediction, by indicators ADX,MACD,RSI,CCI NASDAQ stock exchange
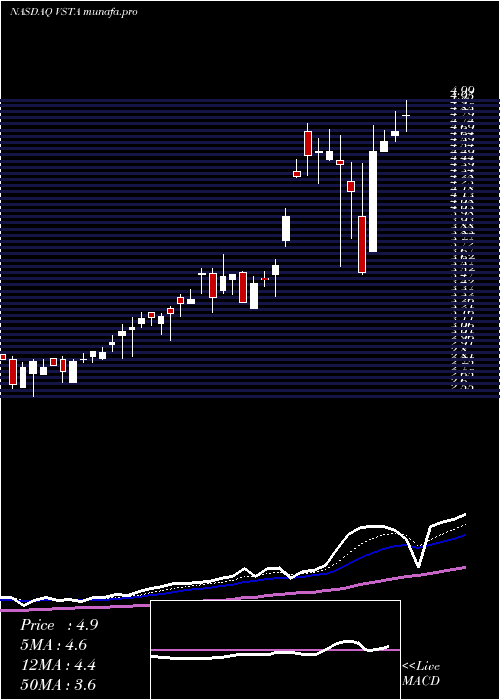
Daily price and charts and targets VastaPlatform Strong Daily Stock price targets for VastaPlatform VSTA are 4.9 and 4.95 | Daily Target 1 | 4.89 | | Daily Target 2 | 4.91 | | Daily Target 3 | 4.94 | | Daily Target 4 | 4.96 | | Daily Target 5 | 4.99 |
Daily price and volume Vasta Platform
| Date |
Closing |
Open |
Range |
Volume |
Wed 12 November 2025 |
4.93 (-0.8%) |
4.94 |
4.92 - 4.97 |
1.3437 times |
Tue 11 November 2025 |
4.97 (0%) |
4.94 |
4.94 - 4.97 |
0.6202 times |
Mon 10 November 2025 |
4.97 (0%) |
4.97 |
4.93 - 4.98 |
0.5857 times |
Fri 07 November 2025 |
4.97 (0%) |
4.80 |
4.80 - 4.97 |
2.0672 times |
Thu 06 November 2025 |
4.97 (0.81%) |
4.93 |
4.88 - 4.98 |
2.7821 times |
Wed 05 November 2025 |
4.93 (0%) |
4.92 |
4.92 - 4.96 |
0.3618 times |
Tue 04 November 2025 |
4.93 (0.61%) |
4.98 |
4.88 - 4.98 |
0.3273 times |
Fri 31 October 2025 |
4.90 (0%) |
4.86 |
4.86 - 4.99 |
0.4996 times |
Fri 31 October 2025 |
4.90 (-0.2%) |
4.86 |
4.86 - 4.99 |
0.4996 times |
Thu 30 October 2025 |
4.91 (0%) |
4.92 |
4.84 - 4.95 |
0.913 times |
Wed 29 October 2025 |
4.91 (-0.41%) |
4.85 |
4.85 - 4.94 |
0.2498 times |
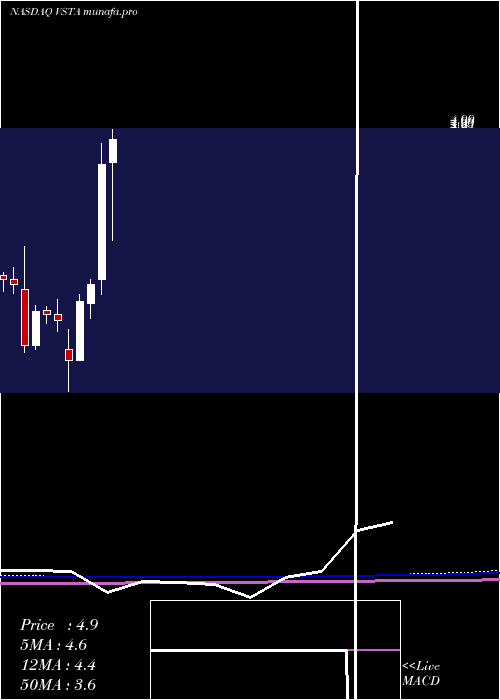
Weekly price and charts VastaPlatform Strong weekly Stock price targets for VastaPlatform VSTA are 4.9 and 4.96 | Weekly Target 1 | 4.88 | | Weekly Target 2 | 4.91 | | Weekly Target 3 | 4.9433333333333 | | Weekly Target 4 | 4.97 | | Weekly Target 5 | 5 |
Weekly price and volumes for Vasta Platform
| Date |
Closing |
Open |
Range |
Volume |
Wed 12 November 2025 |
4.93 (-0.8%) |
4.97 |
4.92 - 4.98 |
0.1808 times |
Fri 07 November 2025 |
4.97 (1.43%) |
4.98 |
4.80 - 4.98 |
0.3927 times |
Fri 31 October 2025 |
4.90 (0%) |
4.86 |
4.86 - 4.99 |
0.0354 times |
Fri 31 October 2025 |
4.90 (-1.61%) |
4.97 |
4.58 - 4.99 |
0.5521 times |
Fri 24 October 2025 |
4.98 (0.61%) |
4.88 |
4.88 - 4.99 |
0.3634 times |
Fri 17 October 2025 |
4.95 (0.61%) |
4.86 |
4.82 - 4.98 |
0.7792 times |
Fri 10 October 2025 |
4.92 (-0.4%) |
4.96 |
4.81 - 4.98 |
1.4314 times |
Fri 03 October 2025 |
4.94 (-0.2%) |
4.96 |
4.89 - 5.00 |
1.2911 times |
Fri 26 September 2025 |
4.95 (0.41%) |
4.84 |
4.84 - 5.00 |
2.7902 times |
Fri 19 September 2025 |
4.93 (8.83%) |
4.59 |
4.54 - 5.00 |
2.1838 times |
Fri 12 September 2025 |
4.53 (-0.22%) |
4.67 |
4.35 - 4.78 |
0.6754 times |

Monthly price and charts VastaPlatform Strong monthly Stock price targets for VastaPlatform VSTA are 4.78 and 4.96 | Monthly Target 1 | 4.72 | | Monthly Target 2 | 4.83 | | Monthly Target 3 | 4.9033333333333 | | Monthly Target 4 | 5.01 | | Monthly Target 5 | 5.08 |
Monthly price and volumes Vasta Platform
| Date |
Closing |
Open |
Range |
Volume |
Wed 12 November 2025 |
4.93 (0.61%) |
4.98 |
4.80 - 4.98 |
0.142 times |
Fri 31 October 2025 |
4.90 (-1.41%) |
4.99 |
4.58 - 4.99 |
0.8761 times |
Tue 30 September 2025 |
4.97 (16.12%) |
4.20 |
4.16 - 5.00 |
1.9694 times |
Fri 29 August 2025 |
4.28 (3.63%) |
4.17 |
3.78 - 4.38 |
0.4659 times |
Thu 31 July 2025 |
4.13 (-3.28%) |
4.21 |
3.90 - 4.30 |
0.3556 times |
Mon 30 June 2025 |
4.27 (1.91%) |
4.12 |
4.00 - 4.50 |
0.8256 times |
Fri 30 May 2025 |
4.19 (-5.84%) |
4.33 |
3.56 - 4.64 |
1.6229 times |
Wed 30 April 2025 |
4.45 (-1.77%) |
4.56 |
3.55 - 5.49 |
2.4836 times |
Mon 31 March 2025 |
4.53 (51.51%) |
3.05 |
2.86 - 4.80 |
0.7739 times |
Fri 28 February 2025 |
2.99 (7.94%) |
2.74 |
2.55 - 3.05 |
0.485 times |
Fri 31 January 2025 |
2.77 (38.5%) |
2.00 |
2.00 - 2.86 |
0.6069 times |
DMA SMA EMA moving averages of Vasta Platform VSTA
DMA (daily moving average) of Vasta Platform VSTA
| DMA period | DMA value | | 5 day DMA | 4.96 | | 12 day DMA | 4.94 | | 20 day DMA | 4.95 | | 35 day DMA | 4.95 | | 50 day DMA | 4.89 | | 100 day DMA | 4.55 | | 150 day DMA | 4.49 | | 200 day DMA | 4.21 | EMA (exponential moving average) of Vasta Platform VSTA
| EMA period | EMA current | EMA prev | EMA prev2 | | 5 day EMA | 4.95 | 4.96 | 4.96 | | 12 day EMA | 4.94 | 4.94 | 4.94 | | 20 day EMA | 4.93 | 4.93 | 4.93 | | 35 day EMA | 4.89 | 4.89 | 4.88 | | 50 day EMA | 4.85 | 4.85 | 4.85 |
SMA (simple moving average) of Vasta Platform VSTA
| SMA period | SMA current | SMA prev | SMA prev2 | | 5 day SMA | 4.96 | 4.96 | 4.95 | | 12 day SMA | 4.94 | 4.94 | 4.94 | | 20 day SMA | 4.95 | 4.95 | 4.95 | | 35 day SMA | 4.95 | 4.95 | 4.95 | | 50 day SMA | 4.89 | 4.88 | 4.87 | | 100 day SMA | 4.55 | 4.54 | 4.53 | | 150 day SMA | 4.49 | 4.49 | 4.49 | | 200 day SMA | 4.21 | 4.2 | 4.19 |
|
|
