VerintSystems VRNT full analysis,charts,indicators,moving averages,SMA,DMA,EMA,ADX,MACD,RSIVerint Systems VRNT WideScreen charts, DMA,SMA,EMA technical analysis, forecast prediction, by indicators ADX,MACD,RSI,CCI NASDAQ stock exchange
operates under Technology sector & deals in EDP Services
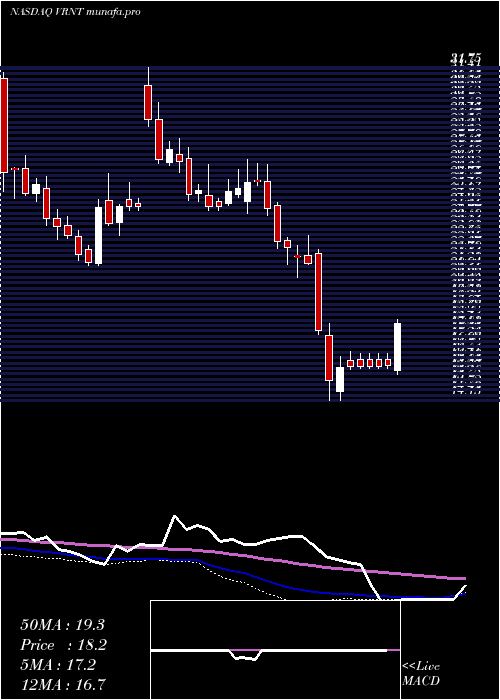
Daily price and charts and targets VerintSystems Strong Daily Stock price targets for VerintSystems VRNT are 20.27 and 20.3 | Daily Target 1 | 20.25 | | Daily Target 2 | 20.26 | | Daily Target 3 | 20.276666666667 | | Daily Target 4 | 20.29 | | Daily Target 5 | 20.31 |
Daily price and volume Verint Systems
| Date |
Closing |
Open |
Range |
Volume |
Fri 31 October 2025 |
20.28 (0.15%) |
20.27 |
20.26 - 20.29 |
0.5458 times |
Thu 30 October 2025 |
20.25 (-0.05%) |
20.28 |
20.25 - 20.29 |
0.9948 times |
Wed 29 October 2025 |
20.26 (0.05%) |
20.27 |
20.25 - 20.31 |
1.2918 times |
Tue 28 October 2025 |
20.25 (-0.2%) |
20.29 |
20.25 - 20.30 |
0.4807 times |
Mon 27 October 2025 |
20.29 (0.1%) |
20.29 |
20.26 - 20.30 |
0.7099 times |
Fri 24 October 2025 |
20.27 (0.1%) |
20.29 |
20.24 - 20.29 |
1.561 times |
Thu 23 October 2025 |
20.25 (-0.05%) |
20.25 |
20.24 - 20.27 |
0.7302 times |
Wed 22 October 2025 |
20.26 (-0.1%) |
20.27 |
20.24 - 20.29 |
2.4174 times |
Tue 21 October 2025 |
20.28 (0%) |
20.27 |
20.26 - 20.30 |
0.7225 times |
Mon 20 October 2025 |
20.28 (0.2%) |
20.43 |
20.24 - 20.45 |
0.5459 times |
Fri 17 October 2025 |
20.24 (0.05%) |
20.24 |
20.23 - 20.26 |
0.5458 times |

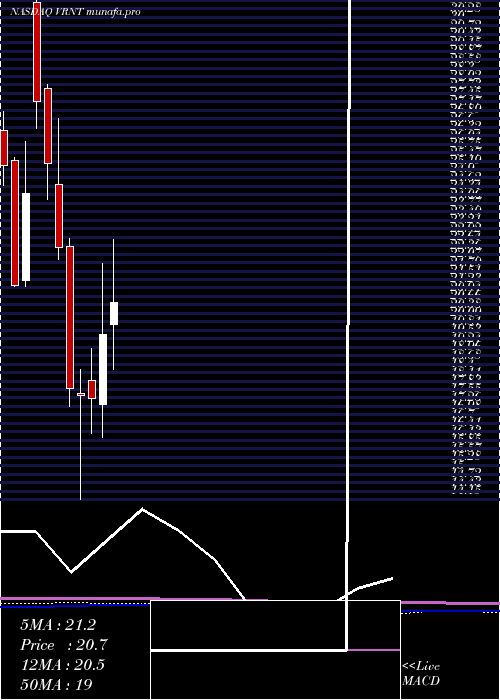
Weekly price and charts VerintSystems Strong weekly Stock price targets for VerintSystems VRNT are 20.24 and 20.3 | Weekly Target 1 | 20.22 | | Weekly Target 2 | 20.25 | | Weekly Target 3 | 20.28 | | Weekly Target 4 | 20.31 | | Weekly Target 5 | 20.34 |
Weekly price and volumes for Verint Systems
| Date |
Closing |
Open |
Range |
Volume |
Fri 31 October 2025 |
20.28 (0.05%) |
20.29 |
20.25 - 20.31 |
0.8561 times |
Fri 24 October 2025 |
20.27 (0.15%) |
20.43 |
20.24 - 20.45 |
1.2719 times |
Fri 17 October 2025 |
20.24 (-0.05%) |
20.29 |
20.23 - 20.30 |
1.0162 times |
Fri 10 October 2025 |
20.25 (-0.1%) |
20.27 |
20.25 - 20.29 |
0.5868 times |
Fri 03 October 2025 |
20.27 (0.05%) |
20.30 |
20.23 - 20.30 |
1.1163 times |
Fri 26 September 2025 |
20.26 (-0.1%) |
20.28 |
20.24 - 20.31 |
1.1557 times |
Fri 19 September 2025 |
20.28 (-0.25%) |
20.33 |
20.26 - 20.36 |
1.2781 times |
Fri 12 September 2025 |
20.33 (-0.15%) |
20.37 |
20.30 - 20.38 |
1.3509 times |
Fri 05 September 2025 |
20.36 (-0.15%) |
20.34 |
20.32 - 20.42 |
1.1178 times |
Fri 29 August 2025 |
20.39 (0%) |
20.39 |
20.36 - 20.41 |
0.2501 times |
Fri 29 August 2025 |
20.39 (-0.39%) |
20.18 |
20.17 - 20.43 |
4.4212 times |
Monthly price and charts VerintSystems Strong monthly Stock price targets for VerintSystems VRNT are 20.26 and 20.48 | Monthly Target 1 | 20.1 | | Monthly Target 2 | 20.19 | | Monthly Target 3 | 20.32 | | Monthly Target 4 | 20.41 | | Monthly Target 5 | 20.54 |
Monthly price and volumes Verint Systems
| Date |
Closing |
Open |
Range |
Volume |
Fri 31 October 2025 |
20.28 (0.15%) |
20.25 |
20.23 - 20.45 |
1.2197 times |
Tue 30 September 2025 |
20.25 (-0.69%) |
20.34 |
20.23 - 20.42 |
1.5432 times |
Fri 29 August 2025 |
20.39 (-4.18%) |
20.85 |
18.40 - 21.88 |
1.8343 times |
Thu 31 July 2025 |
21.28 (8.19%) |
19.99 |
18.50 - 22.84 |
1.5708 times |
Mon 30 June 2025 |
19.67 (12.14%) |
17.33 |
16.23 - 22.04 |
1.2669 times |
Fri 30 May 2025 |
17.54 (-0.57%) |
18.13 |
16.35 - 19.21 |
0.4745 times |
Wed 30 April 2025 |
17.64 (-1.18%) |
17.68 |
14.15 - 18.50 |
0.7189 times |
Mon 31 March 2025 |
17.85 (-20.91%) |
22.62 |
17.27 - 22.87 |
0.5473 times |
Fri 28 February 2025 |
22.57 (-11.07%) |
24.69 |
22.17 - 26.89 |
0.3158 times |
Fri 31 January 2025 |
25.38 (-7.54%) |
27.90 |
24.19 - 28.02 |
0.5086 times |
Tue 31 December 2024 |
27.45 (12.55%) |
30.79 |
26.55 - 31.75 |
0.427 times |
DMA SMA EMA moving averages of Verint Systems VRNT
DMA (daily moving average) of Verint Systems VRNT
| DMA period | DMA value | | 5 day DMA | 20.27 | | 12 day DMA | 20.26 | | 20 day DMA | 20.26 | | 35 day DMA | 20.27 | | 50 day DMA | 20.29 | | 100 day DMA | 20.18 | | 150 day DMA | 19.18 | | 200 day DMA | 20.29 | EMA (exponential moving average) of Verint Systems VRNT
| EMA period | EMA current | EMA prev | EMA prev2 | | 5 day EMA | 20.27 | 20.26 | 20.26 | | 12 day EMA | 20.26 | 20.26 | 20.26 | | 20 day EMA | 20.24 | 20.24 | 20.24 | | 35 day EMA | 20.21 | 20.21 | 20.21 | | 50 day EMA | 20.21 | 20.21 | 20.21 |
SMA (simple moving average) of Verint Systems VRNT
| SMA period | SMA current | SMA prev | SMA prev2 | | 5 day SMA | 20.27 | 20.26 | 20.26 | | 12 day SMA | 20.26 | 20.26 | 20.26 | | 20 day SMA | 20.26 | 20.26 | 20.26 | | 35 day SMA | 20.27 | 20.27 | 20.27 | | 50 day SMA | 20.29 | 20.3 | 20.28 | | 100 day SMA | 20.18 | 20.17 | 20.15 | | 150 day SMA | 19.18 | 19.16 | 19.15 | | 200 day SMA | 20.29 | 20.31 | 20.34 |
|
|
