T2Biosystems TTOO full analysis,charts,indicators,moving averages,SMA,DMA,EMA,ADX,MACD,RSIT2 Biosystems TTOO WideScreen charts, DMA,SMA,EMA technical analysis, forecast prediction, by indicators ADX,MACD,RSI,CCI NASDAQ stock exchange
operates under Health Care sector & deals in Medical Dental Instruments
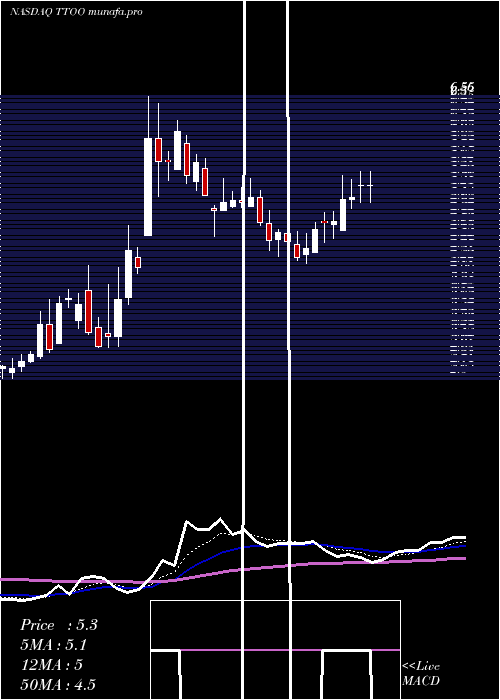
Daily price and charts and targets T2Biosystems Strong Daily Stock price targets for T2Biosystems TTOO are 5.31 and 5.71 | Daily Target 1 | 5.2 | | Daily Target 2 | 5.42 | | Daily Target 3 | 5.6 | | Daily Target 4 | 5.82 | | Daily Target 5 | 6 |
Daily price and volume T2 Biosystems
| Date |
Closing |
Open |
Range |
Volume |
Fri 17 May 2024 |
5.64 (0%) |
5.65 |
5.38 - 5.78 |
0.1983 times |
Thu 16 May 2024 |
5.64 (-5.53%) |
5.97 |
5.15 - 6.45 |
0.7247 times |
Wed 15 May 2024 |
5.97 (43.51%) |
4.61 |
4.61 - 6.56 |
3.4342 times |
Tue 14 May 2024 |
4.16 (-5.24%) |
4.30 |
4.07 - 4.44 |
0.5001 times |
Mon 13 May 2024 |
4.39 (18.65%) |
3.73 |
3.63 - 4.74 |
0.6948 times |
Fri 10 May 2024 |
3.70 (15.99%) |
3.19 |
3.05 - 4.15 |
1.1821 times |
Thu 09 May 2024 |
3.19 (4.59%) |
3.23 |
3.03 - 3.92 |
0.7413 times |
Wed 08 May 2024 |
3.05 (-5.86%) |
3.31 |
3.03 - 3.45 |
0.5385 times |
Tue 07 May 2024 |
3.24 (-10.74%) |
3.83 |
3.22 - 4.18 |
0.9891 times |
Mon 06 May 2024 |
3.63 (-2.42%) |
3.41 |
3.30 - 3.79 |
0.9969 times |
Fri 03 May 2024 |
3.72 (1.92%) |
3.70 |
3.60 - 3.85 |
0.22 times |
Weekly price and charts T2Biosystems Strong weekly Stock price targets for T2Biosystems TTOO are 4.64 and 7.57 | Weekly Target 1 | 2.35 | | Weekly Target 2 | 3.99 | | Weekly Target 3 | 5.2766666666667 | | Weekly Target 4 | 6.92 | | Weekly Target 5 | 8.21 |
Weekly price and volumes for T2 Biosystems
| Date |
Closing |
Open |
Range |
Volume |
Fri 17 May 2024 |
5.64 (52.43%) |
3.73 |
3.63 - 6.56 |
2.5768 times |
Fri 10 May 2024 |
3.70 (-0.54%) |
3.41 |
3.03 - 4.18 |
2.0643 times |
Fri 03 May 2024 |
3.72 (30.99%) |
2.84 |
2.82 - 3.85 |
0.8129 times |
Fri 26 April 2024 |
2.84 (-4.05%) |
3.00 |
2.60 - 3.40 |
1.3345 times |
Fri 19 April 2024 |
2.96 (-5.73%) |
3.12 |
2.79 - 3.24 |
0.5011 times |
Fri 12 April 2024 |
3.14 (10.95%) |
2.85 |
2.75 - 3.38 |
0.4758 times |
Fri 05 April 2024 |
2.83 (-5.67%) |
3.00 |
2.75 - 3.05 |
0.2579 times |
Thu 28 March 2024 |
3.00 (4.53%) |
2.95 |
2.70 - 3.22 |
0.5399 times |
Fri 22 March 2024 |
2.87 (-31.34%) |
4.21 |
2.82 - 4.33 |
1.1237 times |
Fri 15 March 2024 |
4.18 (-14.87%) |
4.90 |
3.95 - 5.04 |
0.313 times |
Fri 08 March 2024 |
4.91 (-7.01%) |
5.29 |
4.66 - 5.57 |
0.2025 times |
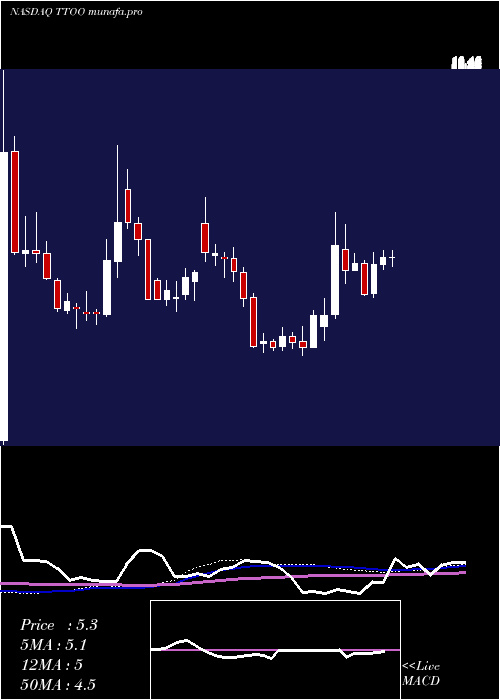
Monthly price and charts T2Biosystems Strong monthly Stock price targets for T2Biosystems TTOO are 4.3 and 7.9 | Monthly Target 1 | 1.45 | | Monthly Target 2 | 3.55 | | Monthly Target 3 | 5.0533333333333 | | Monthly Target 4 | 7.15 | | Monthly Target 5 | 8.65 |
Monthly price and volumes T2 Biosystems
| Date |
Closing |
Open |
Range |
Volume |
Fri 17 May 2024 |
5.64 (67.86%) |
3.36 |
2.96 - 6.56 |
0.0155 times |
Tue 30 April 2024 |
3.36 (12%) |
3.00 |
2.60 - 3.54 |
0.0087 times |
Thu 28 March 2024 |
3.00 (-40.48%) |
5.06 |
2.70 - 5.57 |
0.0068 times |
Thu 29 February 2024 |
5.04 (12%) |
4.40 |
4.13 - 6.95 |
0.0132 times |
Wed 31 January 2024 |
4.50 (-28.34%) |
6.24 |
3.81 - 6.40 |
0.0066 times |
Fri 29 December 2023 |
6.28 (77.4%) |
3.51 |
3.44 - 8.38 |
0.0158 times |
Thu 30 November 2023 |
3.54 (-40.1%) |
5.95 |
3.36 - 6.54 |
0.0104 times |
Tue 31 October 2023 |
5.91 (2586.36%) |
0.22 |
0.17 - 10.46 |
1.0121 times |
Fri 29 September 2023 |
0.22 (-29.03%) |
0.30 |
0.15 - 0.47 |
2.6848 times |
Thu 31 August 2023 |
0.31 (106.67%) |
0.16 |
0.14 - 0.70 |
6.2262 times |
Mon 31 July 2023 |
0.15 (114.29%) |
0.07 |
0.07 - 0.18 |
2.9428 times |

DMA SMA EMA moving averages of T2 Biosystems TTOO
DMA (daily moving average) of T2 Biosystems TTOO
| DMA period | DMA value | | 5 day DMA | 5.16 | | 12 day DMA | 4.17 | | 20 day DMA | 3.68 | | 35 day DMA | 3.37 | | 50 day DMA | 3.46 | | 100 day DMA | 4.27 | | 150 day DMA | 4.42 | | 200 day DMA | 3.47 | EMA (exponential moving average) of T2 Biosystems TTOO
| EMA period | EMA current | EMA prev | EMA prev2 | | 5 day EMA | 5.17 | 4.93 | 4.57 | | 12 day EMA | 4.42 | 4.2 | 3.94 | | 20 day EMA | 4.05 | 3.88 | 3.69 | | 35 day EMA | 3.83 | 3.72 | 3.61 | | 50 day EMA | 3.78 | 3.7 | 3.62 |
SMA (simple moving average) of T2 Biosystems TTOO
| SMA period | SMA current | SMA prev | SMA prev2 | | 5 day SMA | 5.16 | 4.77 | 4.28 | | 12 day SMA | 4.17 | 3.95 | 3.76 | | 20 day SMA | 3.68 | 3.54 | 3.41 | | 35 day SMA | 3.37 | 3.3 | 3.23 | | 50 day SMA | 3.46 | 3.45 | 3.43 | | 100 day SMA | 4.27 | 4.27 | 4.26 | | 150 day SMA | 4.42 | 4.43 | 4.45 | | 200 day SMA | 3.47 | 3.44 | 3.42 |
|
|
