TranslateBio TBIO full analysis,charts,indicators,moving averages,SMA,DMA,EMA,ADX,MACD,RSITranslate Bio TBIO WideScreen charts, DMA,SMA,EMA technical analysis, forecast prediction, by indicators ADX,MACD,RSI,CCI NASDAQ stock exchange
operates under Health Care sector & deals in Biotechnology Biological Products No Diagnostic Substances
Daily price and charts and targets TranslateBio Strong Daily Stock price targets for TranslateBio TBIO are 4.43 and 4.65 | Daily Target 1 | 4.26 | | Daily Target 2 | 4.38 | | Daily Target 3 | 4.48 | | Daily Target 4 | 4.6 | | Daily Target 5 | 4.7 |
Daily price and volume Translate Bio
| Date |
Closing |
Open |
Range |
Volume |
Fri 17 May 2024 |
4.50 (3.45%) |
4.37 |
4.36 - 4.58 |
0.0734 times |
Thu 16 May 2024 |
4.35 (-5.84%) |
4.48 |
4.31 - 4.63 |
0.0583 times |
Wed 15 May 2024 |
4.62 (9.48%) |
4.16 |
4.16 - 4.69 |
0.2942 times |
Tue 14 May 2024 |
4.22 (1.69%) |
3.97 |
3.96 - 4.45 |
0.2044 times |
Mon 13 May 2024 |
4.15 (-18.95%) |
4.51 |
4.02 - 4.53 |
0.2962 times |
Fri 10 May 2024 |
5.12 (-15.23%) |
5.42 |
5.04 - 5.70 |
0.2915 times |
Thu 09 May 2024 |
6.04 (1787.5%) |
5.59 |
4.85 - 6.40 |
0.9372 times |
Wed 08 May 2024 |
0.32 (3.23%) |
0.32 |
0.30 - 0.40 |
4.7883 times |
Tue 07 May 2024 |
0.31 (-8.82%) |
0.32 |
0.28 - 0.32 |
2.904 times |
Mon 06 May 2024 |
0.34 (3.03%) |
0.34 |
0.32 - 0.34 |
0.1526 times |
Fri 03 May 2024 |
0.33 (-5.71%) |
0.34 |
0.32 - 0.36 |
0.5238 times |
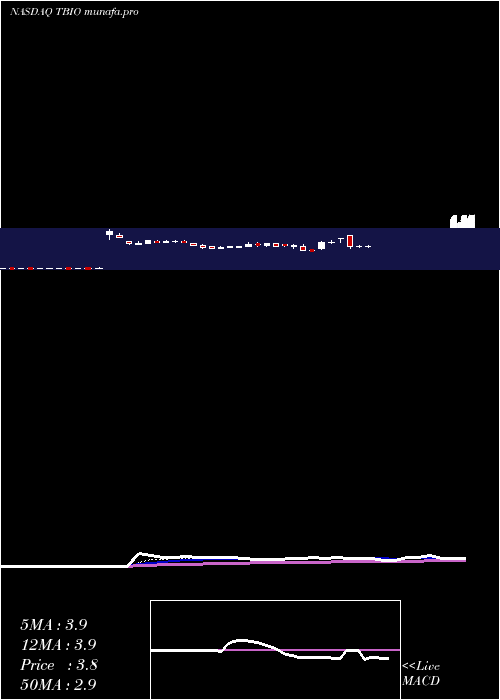
Weekly price and charts TranslateBio Strong weekly Stock price targets for TranslateBio TBIO are 3.87 and 4.6 | Weekly Target 1 | 3.65 | | Weekly Target 2 | 4.08 | | Weekly Target 3 | 4.3833333333333 | | Weekly Target 4 | 4.81 | | Weekly Target 5 | 5.11 |
Weekly price and volumes for Translate Bio
| Date |
Closing |
Open |
Range |
Volume |
Fri 17 May 2024 |
4.50 (-12.11%) |
4.51 |
3.96 - 4.69 |
0.4338 times |
Fri 10 May 2024 |
5.12 (1451.52%) |
0.34 |
0.28 - 6.40 |
4.2485 times |
Fri 03 May 2024 |
0.33 (3.13%) |
0.35 |
0.31 - 0.38 |
0.8318 times |
Fri 26 April 2024 |
0.32 (3.23%) |
0.30 |
0.30 - 0.35 |
0.6553 times |
Fri 19 April 2024 |
0.31 (-24.39%) |
0.39 |
0.30 - 0.46 |
0.9037 times |
Fri 12 April 2024 |
0.41 (-6.82%) |
0.45 |
0.41 - 0.46 |
0.2305 times |
Fri 05 April 2024 |
0.44 (0%) |
0.43 |
0.41 - 0.48 |
0.3061 times |
Thu 28 March 2024 |
0.44 (-2.22%) |
0.43 |
0.43 - 0.49 |
0.4174 times |
Fri 22 March 2024 |
0.45 (-13.46%) |
0.51 |
0.36 - 0.56 |
1.1978 times |
Fri 15 March 2024 |
0.52 (-5.45%) |
0.56 |
0.47 - 0.59 |
0.7751 times |
Fri 08 March 2024 |
0.55 (3.77%) |
0.52 |
0.47 - 0.56 |
1.6846 times |
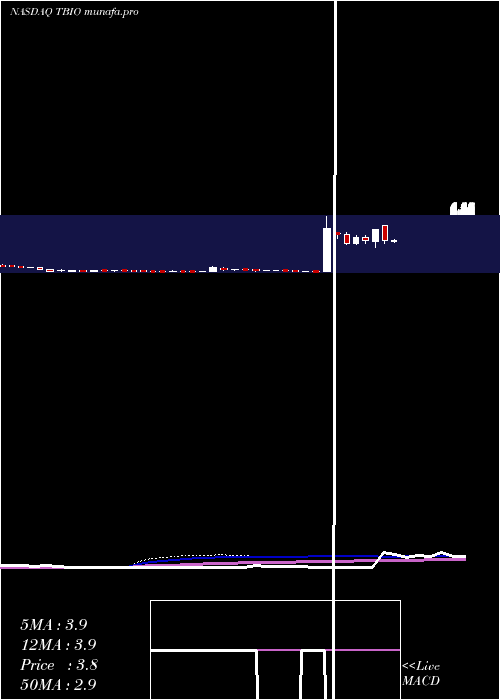
Monthly price and charts TranslateBio Strong monthly Stock price targets for TranslateBio TBIO are 2.39 and 8.51 | Monthly Target 1 | -2.39 | | Monthly Target 2 | 1.05 | | Monthly Target 3 | 3.7266666666667 | | Monthly Target 4 | 7.17 | | Monthly Target 5 | 9.85 |
Monthly price and volumes Translate Bio
| Date |
Closing |
Open |
Range |
Volume |
Fri 17 May 2024 |
4.50 (1150%) |
0.35 |
0.28 - 6.40 |
0.4388 times |
Tue 30 April 2024 |
0.36 (-18.18%) |
0.43 |
0.30 - 0.48 |
0.2036 times |
Thu 28 March 2024 |
0.44 (-21.43%) |
0.56 |
0.36 - 0.59 |
0.366 times |
Thu 29 February 2024 |
0.56 (69.7%) |
0.32 |
0.31 - 0.86 |
6.1017 times |
Wed 31 January 2024 |
0.33 (-17.5%) |
0.39 |
0.30 - 0.46 |
0.3239 times |
Fri 29 December 2023 |
0.40 (-4.76%) |
0.42 |
0.33 - 0.45 |
0.3205 times |
Thu 30 November 2023 |
0.42 (-42.47%) |
0.73 |
0.30 - 0.82 |
1.8608 times |
Tue 31 October 2023 |
0.73 (-29.81%) |
1.17 |
0.73 - 1.17 |
0.0644 times |
Fri 29 September 2023 |
1.04 (-20%) |
1.27 |
1.00 - 1.40 |
0.0777 times |
Thu 31 August 2023 |
1.30 (-16.67%) |
1.55 |
1.05 - 1.59 |
0.2426 times |
Mon 31 July 2023 |
1.56 (-1.27%) |
1.59 |
1.31 - 1.75 |
0.1829 times |

DMA SMA EMA moving averages of Translate Bio TBIO
DMA (daily moving average) of Translate Bio TBIO
| DMA period | DMA value | | 5 day DMA | 4.37 | | 12 day DMA | 2.89 | | 20 day DMA | 1.87 | | 35 day DMA | 1.24 | | 50 day DMA | 1.02 | | 100 day DMA | 0.7 | | 150 day DMA | 0.65 | | 200 day DMA | 0.78 | EMA (exponential moving average) of Translate Bio TBIO
| EMA period | EMA current | EMA prev | EMA prev2 | | 5 day EMA | 4.26 | 4.14 | 4.04 | | 12 day EMA | 3.28 | 3.06 | 2.82 | | 20 day EMA | 2.52 | 2.31 | 2.09 | | 35 day EMA | 1.81 | 1.65 | 1.49 | | 50 day EMA | 1.32 | 1.19 | 1.06 |
SMA (simple moving average) of Translate Bio TBIO
| SMA period | SMA current | SMA prev | SMA prev2 | | 5 day SMA | 4.37 | 4.49 | 4.83 | | 12 day SMA | 2.89 | 2.54 | 2.21 | | 20 day SMA | 1.87 | 1.66 | 1.46 | | 35 day SMA | 1.24 | 1.13 | 1.01 | | 50 day SMA | 1.02 | 0.94 | 0.86 | | 100 day SMA | 0.7 | 0.66 | 0.62 | | 150 day SMA | 0.65 | 0.63 | 0.6 | | 200 day SMA | 0.78 | 0.77 | 0.75 |
|
|
