SiyataMobile SYTAW full analysis,charts,indicators,moving averages,SMA,DMA,EMA,ADX,MACD,RSISiyata Mobile SYTAW WideScreen charts, DMA,SMA,EMA technical analysis, forecast prediction, by indicators ADX,MACD,RSI,CCI NASDAQ stock exchange
Daily price and charts and targets SiyataMobile Strong Daily Stock price targets for SiyataMobile SYTAW are 0.08 and 0.08 | Daily Target 1 | 0.08 | | Daily Target 2 | 0.08 | | Daily Target 3 | 0.08 | | Daily Target 4 | 0.08 | | Daily Target 5 | 0.08 |
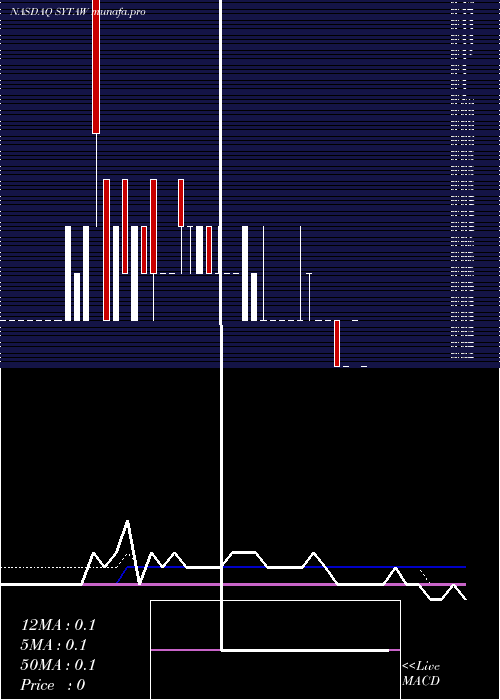
Daily price and volume Siyata Mobile
| Date |
Closing |
Open |
Range |
Volume |
Fri 29 August 2025 |
0.08 (-11.11%) |
0.08 |
0.08 - 0.08 |
0.1521 times |
Thu 28 August 2025 |
0.09 (12.5%) |
0.07 |
0.06 - 0.09 |
0.8492 times |
Wed 27 August 2025 |
0.08 (0%) |
0.08 |
0.08 - 0.10 |
2.6616 times |
Tue 26 August 2025 |
0.08 (14.29%) |
0.05 |
0.05 - 0.09 |
1.7068 times |
Mon 25 August 2025 |
0.07 (0%) |
0.07 |
0.07 - 0.07 |
0.8999 times |
Fri 22 August 2025 |
0.07 (0%) |
0.07 |
0.06 - 0.07 |
0.414 times |
Thu 21 August 2025 |
0.07 (0%) |
0.07 |
0.07 - 0.07 |
0.1014 times |
Wed 20 August 2025 |
0.07 (-12.5%) |
0.06 |
0.06 - 0.08 |
0.2324 times |
Tue 19 August 2025 |
0.08 (-11.11%) |
0.07 |
0.06 - 0.09 |
1.6561 times |
Mon 18 August 2025 |
0.09 (0%) |
0.10 |
0.07 - 0.10 |
1.3266 times |
Fri 15 August 2025 |
0.09 (-10%) |
0.07 |
0.07 - 0.10 |
0.7647 times |
Weekly price and charts SiyataMobile Strong weekly Stock price targets for SiyataMobile SYTAW are 0.07 and 0.12 | Weekly Target 1 | 0.03 | | Weekly Target 2 | 0.05 | | Weekly Target 3 | 0.076666666666667 | | Weekly Target 4 | 0.1 | | Weekly Target 5 | 0.13 |
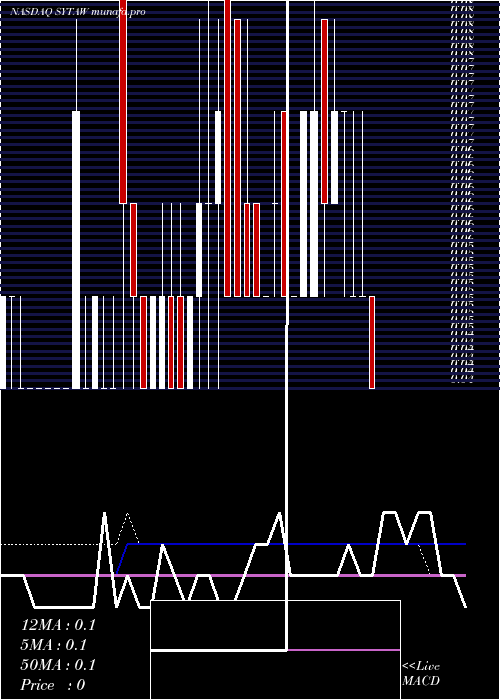
Weekly price and volumes for Siyata Mobile
| Date |
Closing |
Open |
Range |
Volume |
Fri 29 August 2025 |
0.08 (14.29%) |
0.07 |
0.05 - 0.10 |
0.7192 times |
Fri 22 August 2025 |
0.07 (-22.22%) |
0.10 |
0.06 - 0.10 |
0.428 times |
Fri 15 August 2025 |
0.09 (28.57%) |
0.08 |
0.06 - 0.10 |
0.7624 times |
Fri 08 August 2025 |
0.07 (-22.22%) |
0.09 |
0.06 - 0.09 |
0.3693 times |
Fri 01 August 2025 |
0.09 (-18.18%) |
0.12 |
0.04 - 0.12 |
0.7987 times |
Fri 25 July 2025 |
0.11 (-21.43%) |
0.12 |
0.10 - 0.15 |
0.8089 times |
Fri 18 July 2025 |
0.14 (0%) |
0.18 |
0.11 - 0.18 |
1.0948 times |
Fri 11 July 2025 |
0.14 (-6.67%) |
0.16 |
0.13 - 0.23 |
2.3269 times |
Thu 03 July 2025 |
0.15 (25%) |
0.13 |
0.10 - 0.25 |
2.2677 times |
Fri 27 June 2025 |
0.12 (-20%) |
0.16 |
0.10 - 0.16 |
0.4241 times |
Fri 20 June 2025 |
0.15 (0%) |
0.15 |
0.13 - 0.17 |
0.2511 times |
Monthly price and charts SiyataMobile Strong monthly Stock price targets for SiyataMobile SYTAW are 0.06 and 0.12 | Monthly Target 1 | 0.01 | | Monthly Target 2 | 0.05 | | Monthly Target 3 | 0.073333333333333 | | Monthly Target 4 | 0.11 | | Monthly Target 5 | 0.13 |
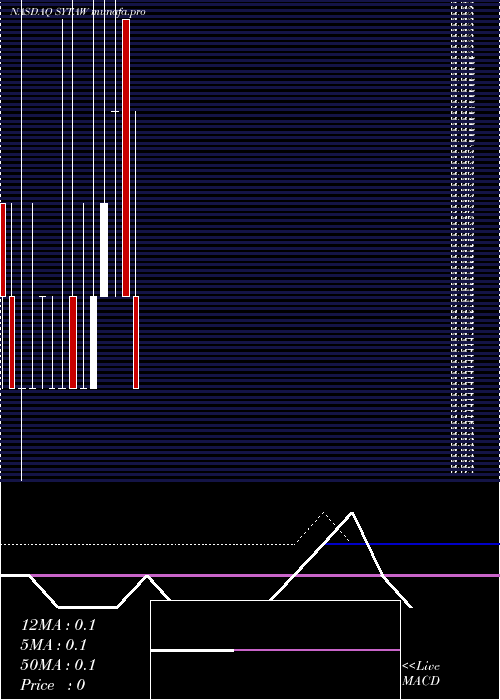
Monthly price and volumes Siyata Mobile
| Date |
Closing |
Open |
Range |
Volume |
Fri 29 August 2025 |
0.08 (-20%) |
0.07 |
0.04 - 0.10 |
0.6666 times |
Thu 31 July 2025 |
0.10 (-44.44%) |
0.18 |
0.07 - 0.25 |
1.5541 times |
Mon 30 June 2025 |
0.18 (-10%) |
0.22 |
0.10 - 0.40 |
0.8774 times |
Fri 30 May 2025 |
0.20 (300%) |
0.05 |
0.05 - 1.18 |
5.0715 times |
Tue 29 April 2025 |
0.05 (0%) |
0.05 |
0.04 - 0.07 |
0.1138 times |
Mon 31 March 2025 |
0.05 (-28.57%) |
0.08 |
0.05 - 0.08 |
0.2332 times |
Fri 28 February 2025 |
0.07 (16.67%) |
0.07 |
0.05 - 0.20 |
0.7734 times |
Fri 31 January 2025 |
0.06 (20%) |
0.05 |
0.05 - 0.10 |
0.3576 times |
Tue 31 December 2024 |
0.05 (25%) |
0.04 |
0.04 - 0.09 |
0.1905 times |
Tue 26 November 2024 |
0.04 (0%) |
0.04 |
0.04 - 0.06 |
0.1619 times |
Thu 31 October 2024 |
0.04 (0%) |
0.05 |
0.04 - 0.17 |
0.9968 times |
DMA SMA EMA moving averages of Siyata Mobile SYTAW
DMA (daily moving average) of Siyata Mobile SYTAW
| DMA period | DMA value | | 5 day DMA | 0.08 | | 12 day DMA | 0.08 | | 20 day DMA | 0.08 | | 35 day DMA | 0.1 | | 50 day DMA | 0.12 | | 100 day DMA | 0.12 | | 150 day DMA | 0.1 | | 200 day DMA | 0.09 | EMA (exponential moving average) of Siyata Mobile SYTAW
| EMA period | EMA current | EMA prev | EMA prev2 | | 5 day EMA | 0.08 | 0.08 | 0.08 | | 12 day EMA | 0.1 | 0.1 | 0.1 | | 20 day EMA | 0.12 | 0.12 | 0.12 | | 35 day EMA | 0.14 | 0.14 | 0.14 | | 50 day EMA | 0.12 | 0.12 | 0.12 |
SMA (simple moving average) of Siyata Mobile SYTAW
| SMA period | SMA current | SMA prev | SMA prev2 | | 5 day SMA | 0.08 | 0.08 | 0.07 | | 12 day SMA | 0.08 | 0.08 | 0.08 | | 20 day SMA | 0.08 | 0.08 | 0.08 | | 35 day SMA | 0.1 | 0.1 | 0.1 | | 50 day SMA | 0.12 | 0.12 | 0.12 | | 100 day SMA | 0.12 | 0.12 | 0.12 | | 150 day SMA | 0.1 | 0.1 | 0.1 | | 200 day SMA | 0.09 | 0.09 | 0.09 |
|
|
