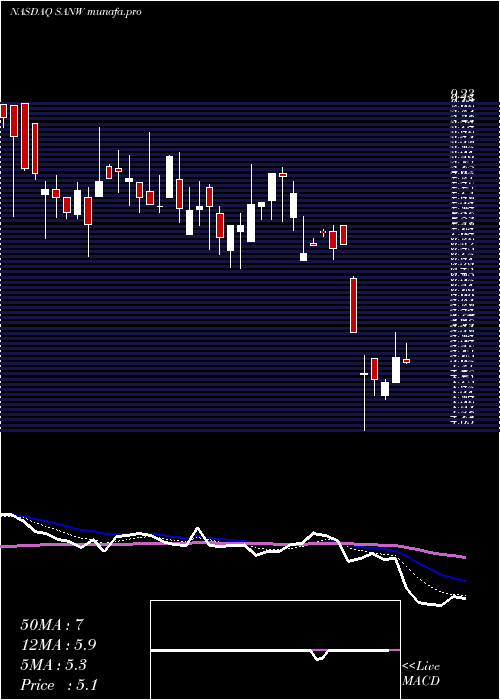
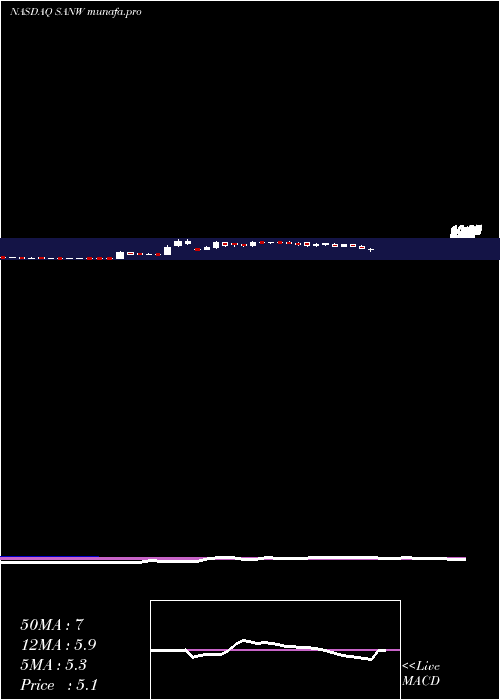
SW SANW full analysis,charts,indicators,moving averages,SMA,DMA,EMA,ADX,MACD,RSIS W SANW WideScreen charts, DMA,SMA,EMA technical analysis, forecast prediction, by indicators ADX,MACD,RSI,CCI NASDAQ stock exchange
operates under Consumer Non Durables sector & deals in Farming Seeds Milling
Daily price and charts and targets SW Strong Daily Stock price targets for SW SANW are 2.29 and 2.45 | Daily Target 1 | 2.24 | | Daily Target 2 | 2.33 | | Daily Target 3 | 2.4033333333333 | | Daily Target 4 | 2.49 | | Daily Target 5 | 2.56 |
Daily price and volume S W
| Date |
Closing |
Open |
Range |
Volume |
Mon 14 July 2025 |
2.41 (0.84%) |
2.43 |
2.32 - 2.48 |
1.7473 times |
Fri 11 July 2025 |
2.39 (-3.24%) |
2.50 |
2.34 - 2.58 |
1.0369 times |
Thu 10 July 2025 |
2.47 (16.51%) |
2.10 |
2.08 - 2.50 |
3.0167 times |
Wed 09 July 2025 |
2.12 (-0.93%) |
2.14 |
2.03 - 2.20 |
0.8843 times |
Tue 08 July 2025 |
2.14 (2.39%) |
2.10 |
2.00 - 2.21 |
0.9485 times |
Mon 07 July 2025 |
2.09 (-4.57%) |
2.20 |
2.03 - 2.20 |
0.5663 times |
Thu 03 July 2025 |
2.19 (2.34%) |
2.17 |
2.14 - 2.21 |
0.6718 times |
Wed 02 July 2025 |
2.14 (0.47%) |
2.08 |
2.06 - 2.18 |
0.3281 times |
Tue 01 July 2025 |
2.13 (-2.29%) |
2.22 |
2.05 - 2.22 |
0.4293 times |
Mon 30 June 2025 |
2.18 (-0.91%) |
2.20 |
2.12 - 2.24 |
0.3708 times |
Fri 27 June 2025 |
2.20 (2.33%) |
2.20 |
2.00 - 2.24 |
0.5748 times |
Weekly price and charts SW Strong weekly Stock price targets for SW SANW are 2.29 and 2.45 | Weekly Target 1 | 2.24 | | Weekly Target 2 | 2.33 | | Weekly Target 3 | 2.4033333333333 | | Weekly Target 4 | 2.49 | | Weekly Target 5 | 2.56 |
Weekly price and volumes for S W
| Date |
Closing |
Open |
Range |
Volume |
Mon 14 July 2025 |
2.41 (0.84%) |
2.43 |
2.32 - 2.48 |
0.538 times |
Fri 11 July 2025 |
2.39 (9.13%) |
2.20 |
2.00 - 2.58 |
1.987 times |
Thu 03 July 2025 |
2.19 (-0.45%) |
2.20 |
2.05 - 2.24 |
0.5543 times |
Fri 27 June 2025 |
2.20 (-58.96%) |
4.85 |
1.99 - 5.05 |
6.322 times |
Fri 20 June 2025 |
5.36 (-3.77%) |
5.58 |
5.06 - 5.58 |
0.0799 times |
Fri 13 June 2025 |
5.57 (1.64%) |
5.56 |
5.45 - 5.72 |
0.0176 times |
Fri 06 June 2025 |
5.48 (1.29%) |
5.63 |
5.41 - 5.88 |
0.0712 times |
Fri 30 May 2025 |
5.41 (-3.91%) |
5.85 |
5.35 - 6.00 |
0.1287 times |
Fri 23 May 2025 |
5.63 (8.48%) |
5.19 |
4.79 - 5.99 |
0.1326 times |
Fri 16 May 2025 |
5.19 (-7.32%) |
5.15 |
4.70 - 5.87 |
0.1687 times |
Fri 09 May 2025 |
5.60 (0.9%) |
5.40 |
4.83 - 5.92 |
0.2556 times |
Monthly price and charts SW Strong monthly Stock price targets for SW SANW are 2.21 and 2.79 | Monthly Target 1 | 1.75 | | Monthly Target 2 | 2.08 | | Monthly Target 3 | 2.33 | | Monthly Target 4 | 2.66 | | Monthly Target 5 | 2.91 |
Monthly price and volumes S W
| Date |
Closing |
Open |
Range |
Volume |
Mon 14 July 2025 |
2.41 (10.55%) |
2.22 |
2.00 - 2.58 |
0.8966 times |
Mon 30 June 2025 |
2.18 (-59.7%) |
5.63 |
1.99 - 5.88 |
1.9972 times |
Fri 30 May 2025 |
5.41 (-9.83%) |
5.82 |
4.70 - 6.83 |
0.2499 times |
Wed 30 April 2025 |
6.00 (-14.04%) |
7.21 |
4.05 - 7.30 |
0.1968 times |
Mon 31 March 2025 |
6.98 (-14.36%) |
7.99 |
6.62 - 8.77 |
0.1588 times |
Fri 28 February 2025 |
8.15 (-11.12%) |
9.26 |
6.81 - 9.71 |
0.2384 times |
Fri 31 January 2025 |
9.17 (14.77%) |
7.75 |
6.93 - 9.99 |
0.3611 times |
Tue 31 December 2024 |
7.99 (-16.25%) |
5.42 |
4.71 - 10.00 |
0.651 times |
Tue 26 November 2024 |
9.54 (314.78%) |
2.23 |
2.10 - 10.68 |
2.0309 times |
Thu 31 October 2024 |
2.30 (1110.53%) |
0.19 |
0.19 - 3.94 |
3.2192 times |
Mon 30 September 2024 |
0.19 (-32.14%) |
0.27 |
0.17 - 0.30 |
2.1653 times |

DMA SMA EMA moving averages of S W SANW
DMA (daily moving average) of S W SANW
| DMA period | DMA value | | 5 day DMA | 2.31 | | 12 day DMA | 2.22 | | 20 day DMA | 3.02 | | 35 day DMA | 4.1 | | 50 day DMA | 4.5 | | 100 day DMA | 5.58 | | 150 day DMA | 6.36 | | 200 day DMA | 5.17 | EMA (exponential moving average) of S W SANW
| EMA period | EMA current | EMA prev | EMA prev2 | | 5 day EMA | 2.34 | 2.3 | 2.26 | | 12 day EMA | 2.52 | 2.54 | 2.57 | | 20 day EMA | 2.95 | 3.01 | 3.08 | | 35 day EMA | 3.59 | 3.66 | 3.73 | | 50 day EMA | 4.31 | 4.39 | 4.47 |
SMA (simple moving average) of S W SANW
| SMA period | SMA current | SMA prev | SMA prev2 | | 5 day SMA | 2.31 | 2.24 | 2.2 | | 12 day SMA | 2.22 | 2.2 | 2.18 | | 20 day SMA | 3.02 | 3.18 | 3.34 | | 35 day SMA | 4.1 | 4.18 | 4.26 | | 50 day SMA | 4.5 | 4.56 | 4.61 | | 100 day SMA | 5.58 | 5.64 | 5.71 | | 150 day SMA | 6.36 | 6.39 | 6.41 | | 200 day SMA | 5.17 | 5.16 | 5.15 |
|
|
