R1Rcm RCM full analysis,charts,indicators,moving averages,SMA,DMA,EMA,ADX,MACD,RSIR1 Rcm RCM WideScreen charts, DMA,SMA,EMA technical analysis, forecast prediction, by indicators ADX,MACD,RSI,CCI NASDAQ stock exchange
operates under Consumer Services sector & deals in Other Consumer Services
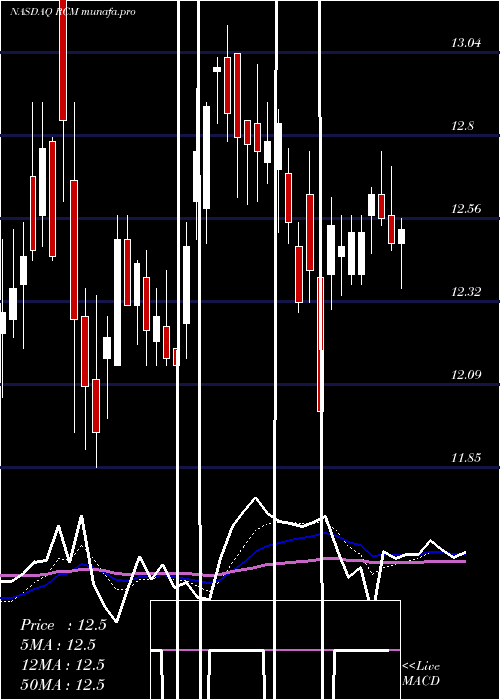
Daily price and charts and targets R1Rcm Strong Daily Stock price targets for R1Rcm RCM are 11.95 and 12.17 | Daily Target 1 | 11.88 | | Daily Target 2 | 12.01 | | Daily Target 3 | 12.1 | | Daily Target 4 | 12.23 | | Daily Target 5 | 12.32 |
Daily price and volume R1 Rcm
| Date |
Closing |
Open |
Range |
Volume |
Thu 23 May 2024 |
12.14 (-0.16%) |
12.19 |
11.97 - 12.19 |
0.9322 times |
Wed 22 May 2024 |
12.16 (-0.98%) |
12.25 |
12.14 - 12.41 |
0.6288 times |
Tue 21 May 2024 |
12.28 (0.33%) |
12.21 |
12.14 - 12.36 |
0.6723 times |
Mon 20 May 2024 |
12.24 (-1.53%) |
12.39 |
12.14 - 12.47 |
0.739 times |
Fri 17 May 2024 |
12.43 (0.97%) |
12.31 |
12.20 - 12.44 |
0.5513 times |
Thu 16 May 2024 |
12.31 (-1.52%) |
12.50 |
12.31 - 12.57 |
0.7504 times |
Wed 15 May 2024 |
12.50 (2.29%) |
12.14 |
12.14 - 12.57 |
0.9104 times |
Tue 14 May 2024 |
12.22 (2.26%) |
12.16 |
11.99 - 12.28 |
0.8749 times |
Mon 13 May 2024 |
11.95 (-1.08%) |
12.10 |
11.85 - 12.34 |
1.6792 times |
Fri 10 May 2024 |
12.08 (-1.55%) |
12.28 |
11.90 - 12.36 |
2.2614 times |
Thu 09 May 2024 |
12.27 (-4.44%) |
12.67 |
11.95 - 12.89 |
5.2807 times |
Weekly price and charts R1Rcm Strong weekly Stock price targets for R1Rcm RCM are 11.81 and 12.31 | Weekly Target 1 | 11.69 | | Weekly Target 2 | 11.92 | | Weekly Target 3 | 12.193333333333 | | Weekly Target 4 | 12.42 | | Weekly Target 5 | 12.69 |
Weekly price and volumes for R1 Rcm
| Date |
Closing |
Open |
Range |
Volume |
Thu 23 May 2024 |
12.14 (-2.33%) |
12.39 |
11.97 - 12.47 |
0.4796 times |
Fri 17 May 2024 |
12.43 (2.9%) |
12.10 |
11.85 - 12.57 |
0.7691 times |
Fri 10 May 2024 |
12.08 (-3.13%) |
12.57 |
11.90 - 13.30 |
2.0627 times |
Fri 03 May 2024 |
12.47 (4.79%) |
12.30 |
12.05 - 12.89 |
0.7114 times |
Fri 26 April 2024 |
11.90 (-0.75%) |
12.08 |
11.50 - 12.08 |
0.7102 times |
Fri 19 April 2024 |
11.99 (-3.85%) |
12.50 |
11.82 - 12.52 |
0.8588 times |
Fri 12 April 2024 |
12.47 (0%) |
12.51 |
12.31 - 13.14 |
0.8235 times |
Fri 05 April 2024 |
12.47 (-3.18%) |
12.91 |
12.25 - 13.01 |
1.1601 times |
Thu 28 March 2024 |
12.88 (-0.92%) |
13.19 |
12.83 - 13.31 |
1.0553 times |
Fri 22 March 2024 |
13.00 (-3.85%) |
13.52 |
12.78 - 13.52 |
1.3693 times |
Fri 15 March 2024 |
13.52 (-2.59%) |
13.89 |
13.35 - 14.20 |
1.6006 times |
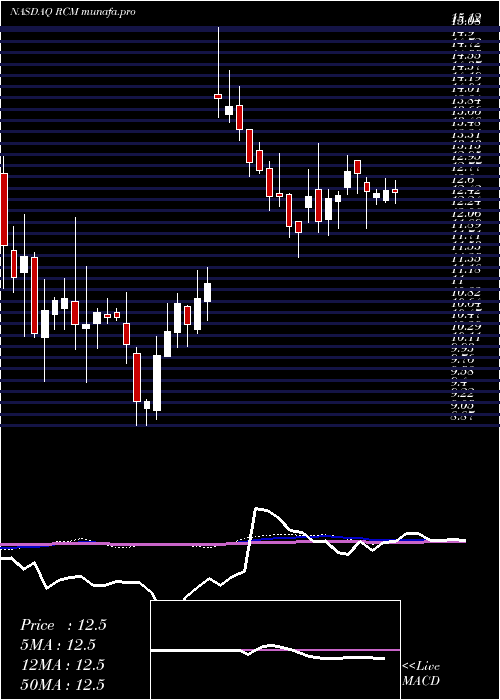
Monthly price and charts R1Rcm Strong monthly Stock price targets for R1Rcm RCM are 11.27 and 12.72 | Monthly Target 1 | 10.98 | | Monthly Target 2 | 11.56 | | Monthly Target 3 | 12.43 | | Monthly Target 4 | 13.01 | | Monthly Target 5 | 13.88 |
Monthly price and volumes R1 Rcm
| Date |
Closing |
Open |
Range |
Volume |
Thu 23 May 2024 |
12.14 (-1.22%) |
12.27 |
11.85 - 13.30 |
0.564 times |
Tue 30 April 2024 |
12.29 (-4.58%) |
12.91 |
11.50 - 13.14 |
0.5957 times |
Thu 28 March 2024 |
12.88 (-8.33%) |
14.07 |
12.78 - 14.45 |
0.9538 times |
Thu 29 February 2024 |
14.05 (37.21%) |
10.26 |
10.11 - 15.12 |
1.5094 times |
Wed 31 January 2024 |
10.24 (-3.12%) |
10.47 |
8.87 - 10.95 |
1.266 times |
Fri 29 December 2023 |
10.57 (-0.09%) |
10.53 |
9.55 - 12.13 |
1.5184 times |
Thu 30 November 2023 |
10.58 (-10.26%) |
11.71 |
9.56 - 12.18 |
0.9631 times |
Tue 31 October 2023 |
11.79 (-21.77%) |
15.02 |
10.95 - 15.26 |
1.2217 times |
Fri 29 September 2023 |
15.07 (-12.59%) |
17.33 |
14.65 - 18.22 |
0.7678 times |
Thu 31 August 2023 |
17.24 (-0.23%) |
17.21 |
15.87 - 18.54 |
0.6401 times |
Mon 31 July 2023 |
17.28 (-6.34%) |
18.40 |
15.92 - 18.71 |
0.5841 times |

DMA SMA EMA moving averages of R1 Rcm RCM
DMA (daily moving average) of R1 Rcm RCM
| DMA period | DMA value | | 5 day DMA | 12.25 | | 12 day DMA | 12.29 | | 20 day DMA | 12.32 | | 35 day DMA | 12.3 | | 50 day DMA | 12.51 | | 100 day DMA | 11.89 | | 150 day DMA | 11.52 | | 200 day DMA | 12.48 | EMA (exponential moving average) of R1 Rcm RCM
| EMA period | EMA current | EMA prev | EMA prev2 | | 5 day EMA | 12.21 | 12.25 | 12.3 | | 12 day EMA | 12.27 | 12.29 | 12.31 | | 20 day EMA | 12.31 | 12.33 | 12.35 | | 35 day EMA | 12.48 | 12.5 | 12.52 | | 50 day EMA | 12.61 | 12.63 | 12.65 |
SMA (simple moving average) of R1 Rcm RCM
| SMA period | SMA current | SMA prev | SMA prev2 | | 5 day SMA | 12.25 | 12.28 | 12.35 | | 12 day SMA | 12.29 | 12.31 | 12.36 | | 20 day SMA | 12.32 | 12.31 | 12.29 | | 35 day SMA | 12.3 | 12.31 | 12.33 | | 50 day SMA | 12.51 | 12.55 | 12.59 | | 100 day SMA | 11.89 | 11.87 | 11.85 | | 150 day SMA | 11.52 | 11.52 | 11.51 | | 200 day SMA | 12.48 | 12.5 | 12.52 |
|
|
