PintecTechnology PT full analysis,charts,indicators,moving averages,SMA,DMA,EMA,ADX,MACD,RSIPintec Technology PT WideScreen charts, DMA,SMA,EMA technical analysis, forecast prediction, by indicators ADX,MACD,RSI,CCI NASDAQ stock exchange
operates under Technology sector & deals in Computer Software Programming Data Processing
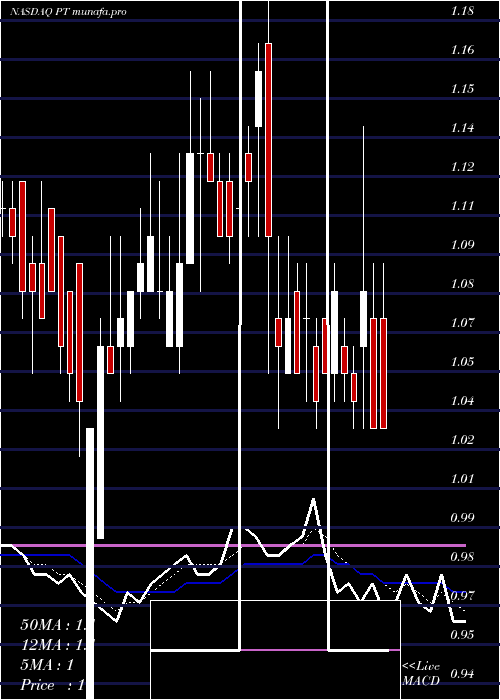
Daily price and charts and targets PintecTechnology Strong Daily Stock price targets for PintecTechnology PT are 0.97 and 1.01 | Daily Target 1 | 0.96 | | Daily Target 2 | 0.98 | | Daily Target 3 | 1.0033333333333 | | Daily Target 4 | 1.02 | | Daily Target 5 | 1.04 |
Daily price and volume Pintec Technology
| Date |
Closing |
Open |
Range |
Volume |
Wed 12 November 2025 |
0.99 (1.02%) |
1.02 |
0.99 - 1.03 |
0.6568 times |
Tue 11 November 2025 |
0.98 (0%) |
0.99 |
0.98 - 1.02 |
0.5606 times |
Mon 10 November 2025 |
0.98 (1.03%) |
0.95 |
0.95 - 1.00 |
0.9565 times |
Fri 07 November 2025 |
0.97 (-3.96%) |
0.98 |
0.95 - 1.00 |
0.1453 times |
Thu 06 November 2025 |
1.01 (0%) |
0.99 |
0.96 - 1.03 |
0.6613 times |
Wed 05 November 2025 |
1.01 (0%) |
0.97 |
0.97 - 1.02 |
0.3524 times |
Tue 04 November 2025 |
1.01 (-2.88%) |
0.99 |
0.97 - 1.01 |
0.6476 times |
Fri 31 October 2025 |
1.04 (0%) |
1.00 |
1.00 - 1.06 |
1.4256 times |
Fri 31 October 2025 |
1.04 (0.97%) |
1.00 |
1.00 - 1.06 |
1.4256 times |
Thu 30 October 2025 |
1.03 (10.75%) |
1.00 |
0.98 - 1.04 |
3.1682 times |
Wed 29 October 2025 |
0.93 (-1.06%) |
0.94 |
0.93 - 1.00 |
0.9188 times |
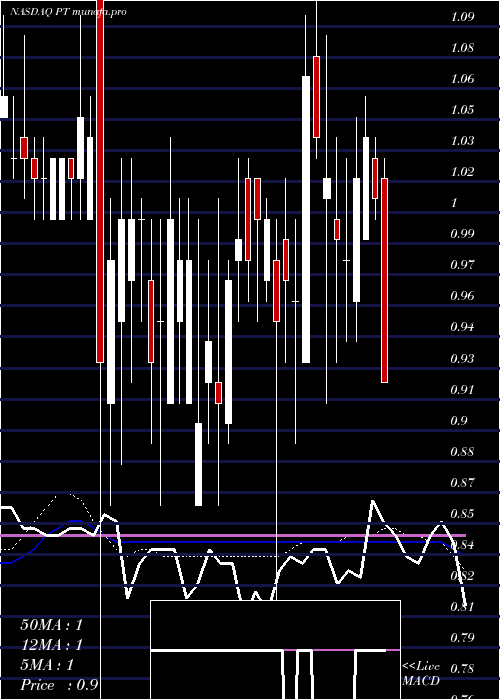
Weekly price and charts PintecTechnology Strong weekly Stock price targets for PintecTechnology PT are 0.97 and 1.05 | Weekly Target 1 | 0.91 | | Weekly Target 2 | 0.95 | | Weekly Target 3 | 0.99 | | Weekly Target 4 | 1.03 | | Weekly Target 5 | 1.07 |
Weekly price and volumes for Pintec Technology
| Date |
Closing |
Open |
Range |
Volume |
Wed 12 November 2025 |
0.99 (2.06%) |
0.95 |
0.95 - 1.03 |
0.3384 times |
Fri 07 November 2025 |
0.97 (-6.73%) |
0.99 |
0.95 - 1.03 |
0.2812 times |
Fri 31 October 2025 |
1.04 (0%) |
1.00 |
1.00 - 1.06 |
0.2219 times |
Fri 31 October 2025 |
1.04 (9.47%) |
0.92 |
0.92 - 1.06 |
1.1645 times |
Fri 24 October 2025 |
0.95 (13.1%) |
0.85 |
0.83 - 1.02 |
0.728 times |
Fri 17 October 2025 |
0.84 (0%) |
0.84 |
0.83 - 0.90 |
0.849 times |
Fri 10 October 2025 |
0.84 (-9.68%) |
0.93 |
0.82 - 0.95 |
1.3892 times |
Fri 03 October 2025 |
0.93 (-2.11%) |
0.97 |
0.88 - 1.02 |
1.6694 times |
Fri 26 September 2025 |
0.95 (-4.04%) |
1.02 |
0.91 - 1.07 |
1.1314 times |
Fri 19 September 2025 |
0.99 (-1%) |
0.98 |
0.91 - 1.03 |
2.2268 times |
Fri 12 September 2025 |
1.00 (5.26%) |
1.21 |
0.91 - 1.38 |
57.2884 times |
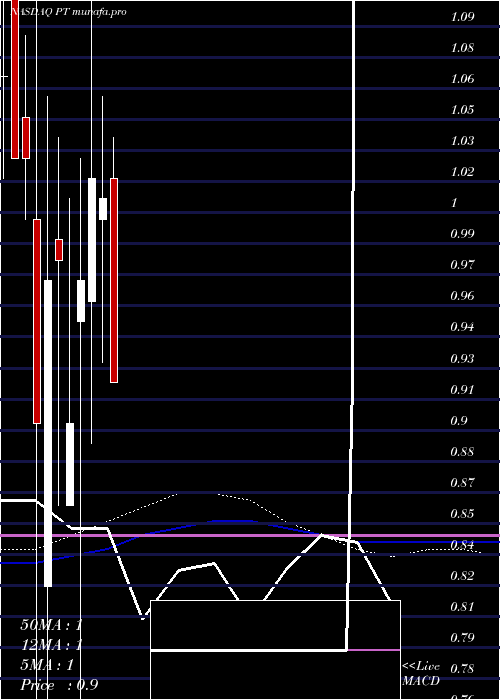
Monthly price and charts PintecTechnology Strong monthly Stock price targets for PintecTechnology PT are 0.95 and 1.03 | Monthly Target 1 | 0.91 | | Monthly Target 2 | 0.95 | | Monthly Target 3 | 0.99 | | Monthly Target 4 | 1.03 | | Monthly Target 5 | 1.07 |
Monthly price and volumes Pintec Technology
| Date |
Closing |
Open |
Range |
Volume |
Wed 12 November 2025 |
0.99 (-4.81%) |
0.99 |
0.95 - 1.03 |
0.0802 times |
Fri 31 October 2025 |
1.04 (9.47%) |
0.95 |
0.82 - 1.06 |
0.6988 times |
Tue 30 September 2025 |
0.95 (0%) |
0.95 |
0.91 - 1.38 |
8.6522 times |
Fri 29 August 2025 |
0.95 (0%) |
0.95 |
0.88 - 1.04 |
0.0225 times |
Thu 31 July 2025 |
0.95 (5.56%) |
0.93 |
0.82 - 1.09 |
0.0979 times |
Mon 30 June 2025 |
0.90 (-1.1%) |
0.94 |
0.82 - 0.97 |
0.0547 times |
Fri 30 May 2025 |
0.91 (-9%) |
1.00 |
0.87 - 1.03 |
0.0664 times |
Wed 30 April 2025 |
1.00 (-0.99%) |
1.02 |
0.92 - 1.05 |
0.0626 times |
Mon 31 March 2025 |
1.01 (-0.98%) |
1.00 |
0.93 - 1.06 |
0.0818 times |
Fri 28 February 2025 |
1.02 (5.15%) |
0.96 |
0.89 - 1.15 |
0.1829 times |
Fri 31 January 2025 |
0.97 (7.78%) |
0.95 |
0.76 - 1.03 |
0.1118 times |
DMA SMA EMA moving averages of Pintec Technology PT
DMA (daily moving average) of Pintec Technology PT
| DMA period | DMA value | | 5 day DMA | 0.99 | | 12 day DMA | 0.99 | | 20 day DMA | 0.97 | | 35 day DMA | 0.94 | | 50 day DMA | 0.96 | | 100 day DMA | 0.96 | | 150 day DMA | 0.96 | | 200 day DMA | 0.97 | EMA (exponential moving average) of Pintec Technology PT
| EMA period | EMA current | EMA prev | EMA prev2 | | 5 day EMA | 0.99 | 0.99 | 0.99 | | 12 day EMA | 0.98 | 0.98 | 0.98 | | 20 day EMA | 0.96 | 0.96 | 0.96 | | 35 day EMA | 0.96 | 0.96 | 0.96 | | 50 day EMA | 0.96 | 0.96 | 0.96 |
SMA (simple moving average) of Pintec Technology PT
| SMA period | SMA current | SMA prev | SMA prev2 | | 5 day SMA | 0.99 | 0.99 | 1 | | 12 day SMA | 0.99 | 1 | 0.99 | | 20 day SMA | 0.97 | 0.96 | 0.96 | | 35 day SMA | 0.94 | 0.94 | 0.94 | | 50 day SMA | 0.96 | 0.96 | 0.96 | | 100 day SMA | 0.96 | 0.96 | 0.95 | | 150 day SMA | 0.96 | 0.96 | 0.96 | | 200 day SMA | 0.97 | 0.97 | 0.97 |
|
|
