OxfordSquare OXSQZ full analysis,charts,indicators,moving averages,SMA,DMA,EMA,ADX,MACD,RSIOxford Square OXSQZ WideScreen charts, DMA,SMA,EMA technical analysis, forecast prediction, by indicators ADX,MACD,RSI,CCI NASDAQ stock exchange
Daily price and charts and targets OxfordSquare Strong Daily Stock price targets for OxfordSquare OXSQZ are 25.11 and 25.13 | Daily Target 1 | 25.11 | | Daily Target 2 | 25.11 | | Daily Target 3 | 25.126666666667 | | Daily Target 4 | 25.13 | | Daily Target 5 | 25.15 |
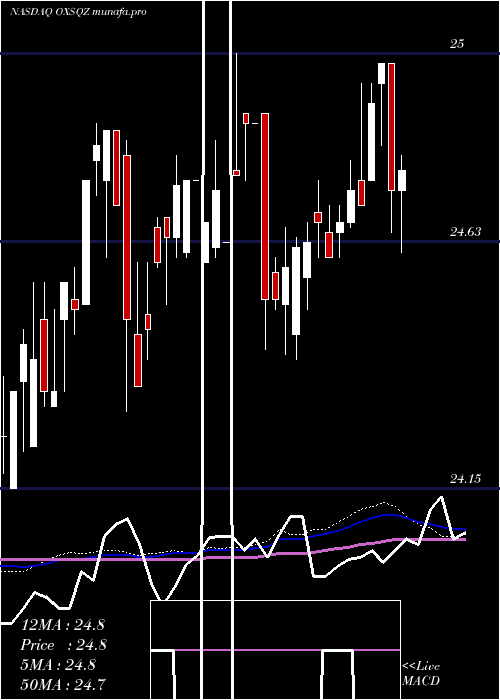
Daily price and volume Oxford Square
| Date |
Closing |
Open |
Range |
Volume |
Fri 29 August 2025 |
25.12 (-0.12%) |
25.12 |
25.12 - 25.14 |
1.5951 times |
Thu 28 August 2025 |
25.15 (0.16%) |
25.15 |
25.15 - 25.15 |
0.2454 times |
Wed 27 August 2025 |
25.11 (-0.16%) |
25.10 |
25.10 - 25.11 |
0.7362 times |
Tue 26 August 2025 |
25.15 (0.24%) |
25.11 |
25.11 - 25.15 |
0.4294 times |
Fri 22 August 2025 |
25.09 (0%) |
25.09 |
25.09 - 25.12 |
1.8405 times |
Thu 21 August 2025 |
25.09 (0.04%) |
25.09 |
25.09 - 25.09 |
2.2086 times |
Wed 20 August 2025 |
25.08 (0.08%) |
25.08 |
25.08 - 25.08 |
0.4908 times |
Tue 19 August 2025 |
25.06 (-0.24%) |
25.07 |
25.06 - 25.07 |
0.7362 times |
Mon 18 August 2025 |
25.12 (0.04%) |
25.08 |
25.07 - 25.12 |
1.3497 times |
Fri 15 August 2025 |
25.11 (-0.08%) |
25.07 |
25.07 - 25.11 |
0.3681 times |
Wed 13 August 2025 |
25.13 (0.52%) |
25.00 |
24.99 - 25.13 |
9.1411 times |

Weekly price and charts OxfordSquare Strong weekly Stock price targets for OxfordSquare OXSQZ are 25.11 and 25.16 | Weekly Target 1 | 25.07 | | Weekly Target 2 | 25.1 | | Weekly Target 3 | 25.123333333333 | | Weekly Target 4 | 25.15 | | Weekly Target 5 | 25.17 |
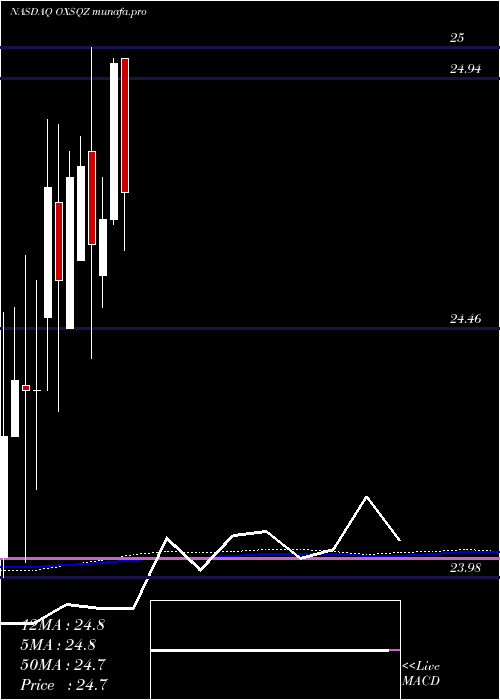
Weekly price and volumes for Oxford Square
| Date |
Closing |
Open |
Range |
Volume |
Fri 29 August 2025 |
25.12 (0.12%) |
25.11 |
25.10 - 25.15 |
0.6257 times |
Fri 22 August 2025 |
25.09 (-0.08%) |
25.08 |
25.06 - 25.12 |
1.379 times |
Fri 15 August 2025 |
25.11 (0.4%) |
25.02 |
24.99 - 25.13 |
2.1707 times |
Fri 08 August 2025 |
25.01 (0%) |
25.06 |
24.99 - 25.06 |
0.6257 times |
Thu 24 July 2025 |
25.01 (-0.2%) |
25.09 |
25.01 - 25.10 |
0.6384 times |
Fri 18 July 2025 |
25.06 (-0.2%) |
25.13 |
24.95 - 25.19 |
0.6405 times |
Fri 11 July 2025 |
25.11 (-0.24%) |
25.01 |
25.01 - 25.25 |
0.5491 times |
Wed 02 July 2025 |
25.17 (0.28%) |
25.02 |
25.02 - 25.22 |
0.1788 times |
Fri 27 June 2025 |
25.10 (0.36%) |
25.01 |
25.00 - 25.12 |
0.7151 times |
Fri 20 June 2025 |
25.01 (0.12%) |
24.97 |
24.96 - 25.05 |
2.4771 times |
Fri 13 June 2025 |
24.98 (0.16%) |
24.94 |
24.88 - 25.00 |
5.2097 times |
Monthly price and charts OxfordSquare Strong monthly Stock price targets for OxfordSquare OXSQZ are 25.06 and 25.22 | Monthly Target 1 | 24.93 | | Monthly Target 2 | 25.02 | | Monthly Target 3 | 25.086666666667 | | Monthly Target 4 | 25.18 | | Monthly Target 5 | 25.25 |
Monthly price and volumes Oxford Square
| Date |
Closing |
Open |
Range |
Volume |
Fri 29 August 2025 |
25.12 (0.24%) |
25.02 |
24.99 - 25.15 |
0.9034 times |
Tue 29 July 2025 |
25.06 (-0.16%) |
25.02 |
24.95 - 25.25 |
0.3914 times |
Fri 27 June 2025 |
25.10 (0.8%) |
24.83 |
24.83 - 25.12 |
1.6975 times |
Fri 30 May 2025 |
24.90 (1.1%) |
24.62 |
24.62 - 24.90 |
1.7364 times |
Wed 30 April 2025 |
24.63 (-1.36%) |
24.98 |
24.50 - 24.98 |
1.3443 times |
Mon 31 March 2025 |
24.97 (1.22%) |
24.67 |
24.66 - 24.98 |
0.6591 times |
Fri 28 February 2025 |
24.67 (0.2%) |
24.56 |
24.50 - 24.75 |
1.1511 times |
Thu 30 January 2025 |
24.62 (-0.61%) |
24.80 |
24.40 - 25.00 |
1.1479 times |
Mon 30 December 2024 |
24.77 (0.08%) |
24.59 |
24.59 - 24.83 |
0.6483 times |
Tue 26 November 2024 |
24.75 (0.81%) |
24.46 |
24.46 - 24.80 |
0.3206 times |
Tue 29 October 2024 |
24.55 (-0.73%) |
24.70 |
24.30 - 24.85 |
0.6946 times |
DMA SMA EMA moving averages of Oxford Square OXSQZ
DMA (daily moving average) of Oxford Square OXSQZ
| DMA period | DMA value | | 5 day DMA | 25.12 | | 12 day DMA | 25.1 | | 20 day DMA | 25.07 | | 35 day DMA | 25.08 | | 50 day DMA | 25.03 | | 100 day DMA | 24.9 | | 150 day DMA | 24.82 | | 200 day DMA | 24.77 | EMA (exponential moving average) of Oxford Square OXSQZ
| EMA period | EMA current | EMA prev | EMA prev2 | | 5 day EMA | 25.12 | 25.12 | 25.1 | | 12 day EMA | 25.09 | 25.09 | 25.08 | | 20 day EMA | 25.09 | 25.09 | 25.08 | | 35 day EMA | 25.04 | 25.04 | 25.03 | | 50 day EMA | 25.02 | 25.02 | 25.01 |
SMA (simple moving average) of Oxford Square OXSQZ
| SMA period | SMA current | SMA prev | SMA prev2 | | 5 day SMA | 25.12 | 25.12 | 25.1 | | 12 day SMA | 25.1 | 25.09 | 25.08 | | 20 day SMA | 25.07 | 25.07 | 25.06 | | 35 day SMA | 25.08 | 25.07 | 25.07 | | 50 day SMA | 25.03 | 25.03 | 25.02 | | 100 day SMA | 24.9 | 24.89 | 24.89 | | 150 day SMA | 24.82 | 24.82 | 24.81 | | 200 day SMA | 24.77 | 24.76 | 24.76 |
|
|
