OntrakInc OTRK full analysis,charts,indicators,moving averages,SMA,DMA,EMA,ADX,MACD,RSIOntrak Inc OTRK WideScreen charts, DMA,SMA,EMA technical analysis, forecast prediction, by indicators ADX,MACD,RSI,CCI NASDAQ stock exchange
Daily price and charts and targets OntrakInc Strong Daily Stock price targets for OntrakInc OTRK are 0.43 and 0.46 | Daily Target 1 | 0.41 | | Daily Target 2 | 0.42 | | Daily Target 3 | 0.43666666666667 | | Daily Target 4 | 0.45 | | Daily Target 5 | 0.47 |
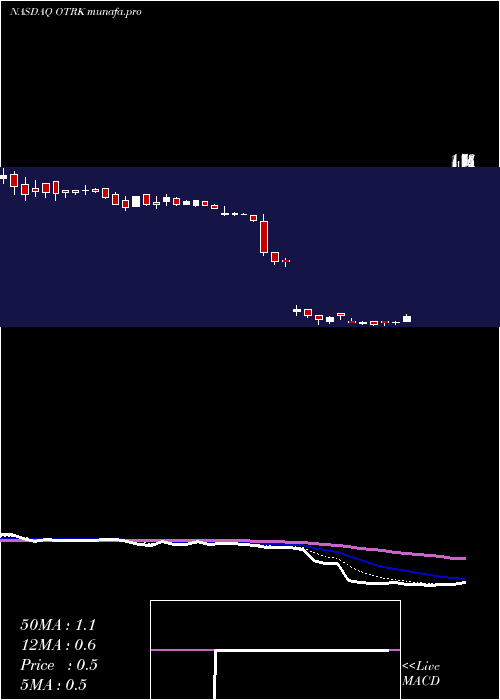
Daily price and volume Ontrak Inc
| Date |
Closing |
Open |
Range |
Volume |
Fri 11 July 2025 |
0.44 (0%) |
0.44 |
0.42 - 0.45 |
0.2187 times |
Thu 10 July 2025 |
0.44 (4.76%) |
0.45 |
0.41 - 0.45 |
0.3192 times |
Wed 09 July 2025 |
0.42 (-4.55%) |
0.45 |
0.41 - 0.45 |
0.6135 times |
Tue 08 July 2025 |
0.44 (0%) |
0.43 |
0.42 - 0.45 |
0.5267 times |
Mon 07 July 2025 |
0.44 (-12%) |
0.45 |
0.44 - 0.47 |
0.952 times |
Thu 03 July 2025 |
0.50 (4.17%) |
0.52 |
0.46 - 0.52 |
4.0505 times |
Wed 02 July 2025 |
0.48 (4.35%) |
0.45 |
0.43 - 0.49 |
0.5755 times |
Tue 01 July 2025 |
0.46 (-8%) |
0.50 |
0.42 - 0.50 |
0.9663 times |
Mon 30 June 2025 |
0.50 (-9.09%) |
0.55 |
0.48 - 0.55 |
0.4117 times |
Fri 27 June 2025 |
0.55 (-43.3%) |
0.53 |
0.50 - 0.59 |
1.3661 times |
Thu 26 June 2025 |
0.97 (0%) |
0.98 |
0.93 - 1.00 |
0.0342 times |
Weekly price and charts OntrakInc Strong weekly Stock price targets for OntrakInc OTRK are 0.4 and 0.46 | Weekly Target 1 | 0.38 | | Weekly Target 2 | 0.41 | | Weekly Target 3 | 0.44 | | Weekly Target 4 | 0.47 | | Weekly Target 5 | 0.5 |
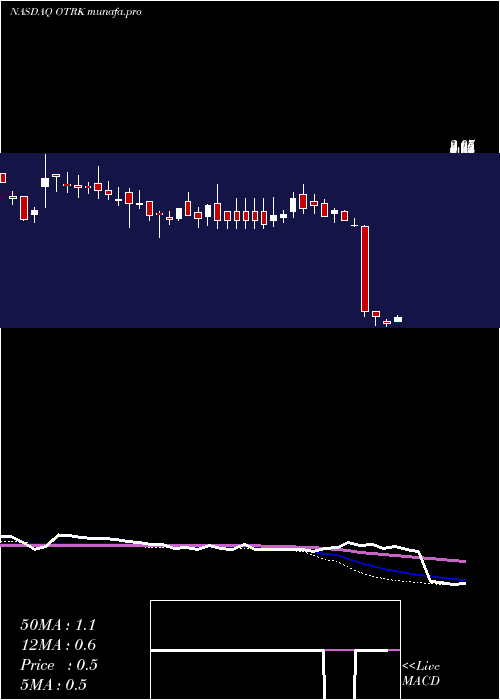
Weekly price and volumes for Ontrak Inc
| Date |
Closing |
Open |
Range |
Volume |
Fri 11 July 2025 |
0.44 (-12%) |
0.45 |
0.41 - 0.47 |
2.5143 times |
Thu 03 July 2025 |
0.50 (-9.09%) |
0.55 |
0.42 - 0.55 |
5.7395 times |
Fri 27 June 2025 |
0.55 (-60.14%) |
1.37 |
0.50 - 1.38 |
1.4685 times |
Fri 20 June 2025 |
1.38 (-3.5%) |
1.38 |
1.37 - 1.45 |
0.0213 times |
Fri 13 June 2025 |
1.43 (-6.54%) |
1.52 |
1.43 - 1.53 |
0.0217 times |
Fri 06 June 2025 |
1.53 (4.08%) |
1.50 |
1.41 - 1.55 |
0.0552 times |
Fri 30 May 2025 |
1.47 (-6.37%) |
1.59 |
1.47 - 1.63 |
0.0389 times |
Fri 23 May 2025 |
1.57 (1.29%) |
1.61 |
1.50 - 1.68 |
0.0429 times |
Fri 16 May 2025 |
1.55 (-5.49%) |
1.68 |
1.50 - 1.78 |
0.0727 times |
Fri 09 May 2025 |
1.64 (10.07%) |
1.52 |
1.46 - 1.70 |
0.0251 times |
Fri 02 May 2025 |
1.49 (0.68%) |
1.46 |
1.41 - 1.53 |
0.0325 times |
Monthly price and charts OntrakInc Strong monthly Stock price targets for OntrakInc OTRK are 0.37 and 0.48 | Monthly Target 1 | 0.35 | | Monthly Target 2 | 0.39 | | Monthly Target 3 | 0.45666666666667 | | Monthly Target 4 | 0.5 | | Monthly Target 5 | 0.57 |
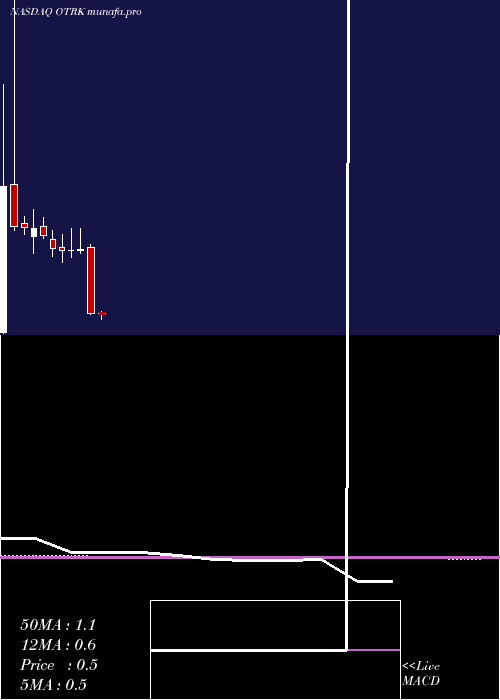
Monthly price and volumes Ontrak Inc
| Date |
Closing |
Open |
Range |
Volume |
Fri 11 July 2025 |
0.44 (-12%) |
0.50 |
0.41 - 0.52 |
1.4853 times |
Mon 30 June 2025 |
0.50 (-65.99%) |
1.50 |
0.48 - 1.55 |
0.3704 times |
Fri 30 May 2025 |
1.47 (1.38%) |
1.45 |
1.41 - 1.78 |
0.0371 times |
Wed 30 April 2025 |
1.45 (0%) |
1.45 |
1.35 - 1.78 |
0.0298 times |
Mon 31 March 2025 |
1.45 (-2.03%) |
1.50 |
1.27 - 1.70 |
0.0161 times |
Fri 28 February 2025 |
1.48 (-11.9%) |
1.62 |
1.36 - 1.75 |
0.0359 times |
Fri 31 January 2025 |
1.68 (-6.15%) |
1.81 |
1.63 - 1.95 |
0.0882 times |
Tue 31 December 2024 |
1.79 (-0.56%) |
1.66 |
1.41 - 2.07 |
0.072 times |
Tue 26 November 2024 |
1.80 (-0.55%) |
1.86 |
1.70 - 1.97 |
0.064 times |
Thu 31 October 2024 |
1.81 (-25.51%) |
2.45 |
1.75 - 5.53 |
7.8014 times |
Mon 30 September 2024 |
2.43 (1057.14%) |
0.21 |
0.19 - 3.98 |
0.5247 times |
DMA SMA EMA moving averages of Ontrak Inc OTRK
DMA (daily moving average) of Ontrak Inc OTRK
| DMA period | DMA value | | 5 day DMA | 0.44 | | 12 day DMA | 0.55 | | 20 day DMA | 0.88 | | 35 day DMA | 1.15 | | 50 day DMA | 1.28 | | 100 day DMA | 1.38 | | 150 day DMA | 1.48 | | 200 day DMA | 1.6 | EMA (exponential moving average) of Ontrak Inc OTRK
| EMA period | EMA current | EMA prev | EMA prev2 | | 5 day EMA | 0.45 | 0.46 | 0.47 | | 12 day EMA | 0.6 | 0.63 | 0.67 | | 20 day EMA | 0.78 | 0.82 | 0.86 | | 35 day EMA | 0.99 | 1.02 | 1.05 | | 50 day EMA | 1.21 | 1.24 | 1.27 |
SMA (simple moving average) of Ontrak Inc OTRK
| SMA period | SMA current | SMA prev | SMA prev2 | | 5 day SMA | 0.44 | 0.45 | 0.46 | | 12 day SMA | 0.55 | 0.6 | 0.68 | | 20 day SMA | 0.88 | 0.93 | 0.98 | | 35 day SMA | 1.15 | 1.19 | 1.22 | | 50 day SMA | 1.28 | 1.3 | 1.32 | | 100 day SMA | 1.38 | 1.39 | 1.4 | | 150 day SMA | 1.48 | 1.49 | 1.5 | | 200 day SMA | 1.6 | 1.6 | 1.6 |
|
|
