OfficeProperties OPINL full analysis,charts,indicators,moving averages,SMA,DMA,EMA,ADX,MACD,RSIOffice Properties OPINL WideScreen charts, DMA,SMA,EMA technical analysis, forecast prediction, by indicators ADX,MACD,RSI,CCI NASDAQ stock exchange
Daily price and charts and targets OfficeProperties Strong Daily Stock price targets for OfficeProperties OPINL are 6.7 and 6.72 | Daily Target 1 | 6.7 | | Daily Target 2 | 6.7 | | Daily Target 3 | 6.7166666666667 | | Daily Target 4 | 6.72 | | Daily Target 5 | 6.74 |
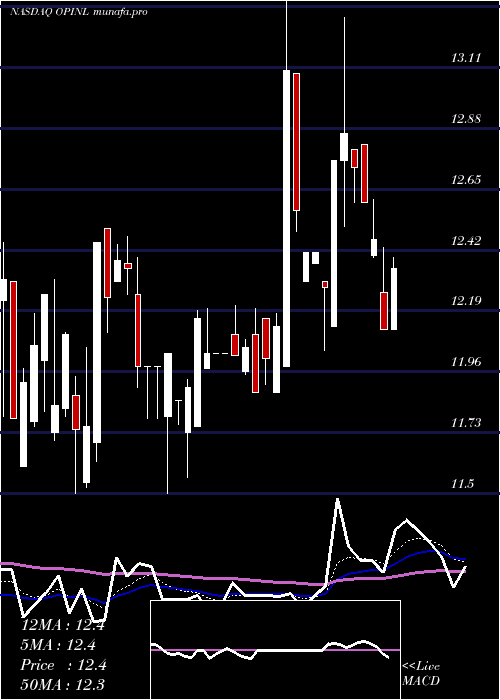
Daily price and volume Office Properties
| Date |
Closing |
Open |
Range |
Volume |
Fri 29 August 2025 |
6.71 (0.15%) |
6.73 |
6.71 - 6.73 |
0.1479 times |
Thu 28 August 2025 |
6.70 (-1.62%) |
6.69 |
6.65 - 6.85 |
0.2773 times |
Wed 27 August 2025 |
6.81 (0.44%) |
6.78 |
6.60 - 6.89 |
3.3919 times |
Tue 26 August 2025 |
6.78 (3.51%) |
6.60 |
6.60 - 6.86 |
2.1811 times |
Mon 25 August 2025 |
6.55 (-2.24%) |
6.70 |
6.51 - 6.80 |
1.2569 times |
Fri 22 August 2025 |
6.70 (0%) |
6.70 |
6.64 - 6.76 |
0.6192 times |
Thu 21 August 2025 |
6.70 (-0.59%) |
6.66 |
6.62 - 6.83 |
0.1664 times |
Wed 20 August 2025 |
6.74 (0%) |
6.75 |
6.74 - 6.87 |
0.3512 times |
Tue 19 August 2025 |
6.74 (3.69%) |
6.50 |
6.50 - 6.97 |
0.9242 times |
Mon 18 August 2025 |
6.50 (-0.15%) |
6.51 |
6.46 - 6.67 |
0.6839 times |
Fri 15 August 2025 |
6.51 (-8.31%) |
6.21 |
6.00 - 6.65 |
3.6506 times |
Weekly price and charts OfficeProperties Strong weekly Stock price targets for OfficeProperties OPINL are 6.61 and 6.99 | Weekly Target 1 | 6.32 | | Weekly Target 2 | 6.52 | | Weekly Target 3 | 6.7033333333333 | | Weekly Target 4 | 6.9 | | Weekly Target 5 | 7.08 |
Weekly price and volumes for Office Properties
| Date |
Closing |
Open |
Range |
Volume |
Fri 29 August 2025 |
6.71 (0.15%) |
6.70 |
6.51 - 6.89 |
0.9801 times |
Fri 22 August 2025 |
6.70 (2.92%) |
6.51 |
6.46 - 6.97 |
0.3708 times |
Fri 15 August 2025 |
6.51 (-8.95%) |
7.06 |
6.00 - 7.14 |
1.5956 times |
Fri 08 August 2025 |
7.15 (0.28%) |
7.11 |
6.70 - 7.15 |
0.6205 times |
Fri 01 August 2025 |
7.13 (2.74%) |
6.90 |
6.71 - 7.43 |
1.3209 times |
Fri 25 July 2025 |
6.94 (0.43%) |
6.97 |
6.64 - 7.10 |
0.7266 times |
Fri 18 July 2025 |
6.91 (-0.43%) |
6.75 |
6.66 - 7.05 |
1.0843 times |
Fri 11 July 2025 |
6.94 (6.44%) |
6.38 |
6.38 - 7.15 |
1.8278 times |
Thu 03 July 2025 |
6.52 (-5.51%) |
6.62 |
6.15 - 6.94 |
1.1486 times |
Fri 27 June 2025 |
6.90 (-1.43%) |
7.02 |
6.58 - 7.15 |
0.3246 times |
Fri 20 June 2025 |
7.00 (9.55%) |
6.55 |
6.50 - 7.35 |
0.3658 times |

Monthly price and charts OfficeProperties Strong monthly Stock price targets for OfficeProperties OPINL are 5.71 and 7.01 | Monthly Target 1 | 5.37 | | Monthly Target 2 | 6.04 | | Monthly Target 3 | 6.67 | | Monthly Target 4 | 7.34 | | Monthly Target 5 | 7.97 |
Monthly price and volumes Office Properties
| Date |
Closing |
Open |
Range |
Volume |
Fri 29 August 2025 |
6.71 (-8.58%) |
7.29 |
6.00 - 7.30 |
0.7396 times |
Thu 31 July 2025 |
7.34 (19.35%) |
6.26 |
6.21 - 7.43 |
1.0641 times |
Mon 30 June 2025 |
6.15 (-3.91%) |
6.11 |
6.05 - 7.35 |
0.6463 times |
Fri 30 May 2025 |
6.40 (-26.44%) |
8.50 |
5.52 - 8.50 |
1.2181 times |
Wed 30 April 2025 |
8.70 (16.94%) |
7.62 |
7.22 - 9.15 |
1.0959 times |
Mon 31 March 2025 |
7.44 (-25.38%) |
9.82 |
7.44 - 10.21 |
1.7787 times |
Fri 28 February 2025 |
9.97 (-19.66%) |
12.30 |
9.57 - 13.30 |
0.9463 times |
Fri 31 January 2025 |
12.41 (-0.32%) |
12.50 |
11.50 - 13.37 |
0.3816 times |
Tue 31 December 2024 |
12.45 (-2.73%) |
11.82 |
11.50 - 12.45 |
0.6321 times |
Tue 26 November 2024 |
12.80 (7.83%) |
11.50 |
10.50 - 13.00 |
1.4973 times |
Thu 31 October 2024 |
11.87 (-19.25%) |
14.68 |
10.61 - 14.83 |
1.4925 times |

DMA SMA EMA moving averages of Office Properties OPINL
DMA (daily moving average) of Office Properties OPINL
| DMA period | DMA value | | 5 day DMA | 6.71 | | 12 day DMA | 6.71 | | 20 day DMA | 6.81 | | 35 day DMA | 6.86 | | 50 day DMA | 6.83 | | 100 day DMA | 6.94 | | 150 day DMA | 8.06 | | 200 day DMA | 9 | EMA (exponential moving average) of Office Properties OPINL
| EMA period | EMA current | EMA prev | EMA prev2 | | 5 day EMA | 6.72 | 6.73 | 6.74 | | 12 day EMA | 6.74 | 6.75 | 6.76 | | 20 day EMA | 6.78 | 6.79 | 6.8 | | 35 day EMA | 6.78 | 6.78 | 6.79 | | 50 day EMA | 6.79 | 6.79 | 6.79 |
SMA (simple moving average) of Office Properties OPINL
| SMA period | SMA current | SMA prev | SMA prev2 | | 5 day SMA | 6.71 | 6.71 | 6.71 | | 12 day SMA | 6.71 | 6.73 | 6.75 | | 20 day SMA | 6.81 | 6.84 | 6.86 | | 35 day SMA | 6.86 | 6.87 | 6.87 | | 50 day SMA | 6.83 | 6.82 | 6.82 | | 100 day SMA | 6.94 | 6.95 | 6.96 | | 150 day SMA | 8.06 | 8.09 | 8.13 | | 200 day SMA | 9 | 9.02 | 9.05 |
|
|
