OfficeDepot ODP full analysis,charts,indicators,moving averages,SMA,DMA,EMA,ADX,MACD,RSIOffice Depot ODP WideScreen charts, DMA,SMA,EMA technical analysis, forecast prediction, by indicators ADX,MACD,RSI,CCI NASDAQ stock exchange
operates under Consumer Services sector & deals in Other Specialty Stores
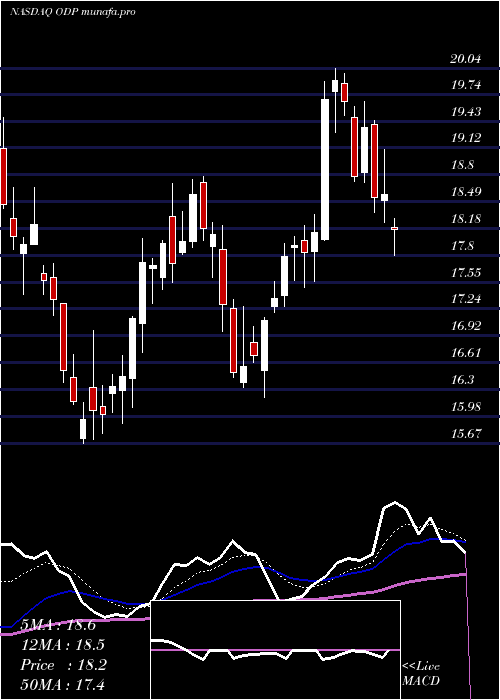
Daily price and charts and targets OfficeDepot Strong Daily Stock price targets for OfficeDepot ODP are 27.84 and 27.97 | Daily Target 1 | 27.73 | | Daily Target 2 | 27.81 | | Daily Target 3 | 27.863333333333 | | Daily Target 4 | 27.94 | | Daily Target 5 | 27.99 |
Daily price and volume Office Depot
| Date |
Closing |
Open |
Range |
Volume |
Fri 31 October 2025 |
27.88 (0.22%) |
27.80 |
27.79 - 27.92 |
0.9542 times |
Thu 30 October 2025 |
27.82 (0.18%) |
27.79 |
27.78 - 27.84 |
1.6686 times |
Wed 29 October 2025 |
27.77 (-0.11%) |
27.79 |
27.77 - 27.83 |
1.6837 times |
Tue 28 October 2025 |
27.80 (0%) |
27.82 |
27.77 - 27.84 |
1.0783 times |
Mon 27 October 2025 |
27.80 (0.14%) |
27.81 |
27.76 - 27.82 |
0.6146 times |
Fri 24 October 2025 |
27.76 (-0.07%) |
27.78 |
27.75 - 27.83 |
0.7364 times |
Thu 23 October 2025 |
27.78 (0.04%) |
27.77 |
27.76 - 27.82 |
0.7154 times |
Wed 22 October 2025 |
27.77 (-0.04%) |
27.77 |
27.75 - 27.82 |
1.3445 times |
Tue 21 October 2025 |
27.78 (-0.07%) |
27.78 |
27.77 - 27.83 |
0.6477 times |
Mon 20 October 2025 |
27.80 (0.14%) |
27.80 |
27.75 - 27.82 |
0.5566 times |
Fri 17 October 2025 |
27.76 (-0.11%) |
27.77 |
27.68 - 27.79 |
0.8517 times |
Weekly price and charts OfficeDepot Strong weekly Stock price targets for OfficeDepot ODP are 27.82 and 27.98 | Weekly Target 1 | 27.69 | | Weekly Target 2 | 27.79 | | Weekly Target 3 | 27.853333333333 | | Weekly Target 4 | 27.95 | | Weekly Target 5 | 28.01 |
Weekly price and volumes for Office Depot
| Date |
Closing |
Open |
Range |
Volume |
Fri 31 October 2025 |
27.88 (0.43%) |
27.81 |
27.76 - 27.92 |
1.1018 times |
Fri 24 October 2025 |
27.76 (0%) |
27.80 |
27.75 - 27.83 |
0.7347 times |
Fri 17 October 2025 |
27.76 (0.14%) |
27.79 |
27.68 - 27.97 |
0.7358 times |
Fri 10 October 2025 |
27.72 (-0.54%) |
27.84 |
27.65 - 27.87 |
1.6765 times |
Fri 03 October 2025 |
27.87 (-0.39%) |
27.98 |
27.80 - 27.98 |
1.1012 times |
Fri 26 September 2025 |
27.98 (34.39%) |
27.73 |
27.61 - 28.04 |
3.1423 times |
Fri 19 September 2025 |
20.82 (0.43%) |
20.35 |
20.05 - 22.61 |
0.6369 times |
Fri 12 September 2025 |
20.73 (-6.66%) |
22.13 |
20.18 - 22.13 |
0.4612 times |
Fri 05 September 2025 |
22.21 (9.62%) |
19.90 |
19.52 - 22.29 |
0.3365 times |
Fri 29 August 2025 |
20.26 (0%) |
20.73 |
20.22 - 20.92 |
0.0732 times |
Fri 29 August 2025 |
20.26 (-5.02%) |
21.09 |
20.00 - 21.63 |
0.4831 times |
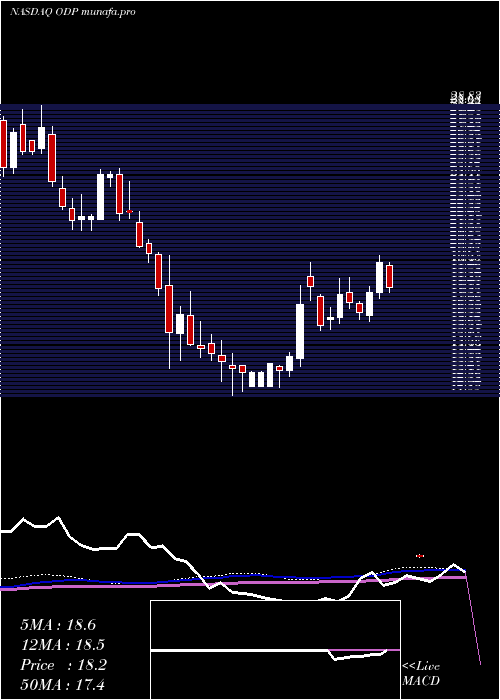
Monthly price and charts OfficeDepot Strong monthly Stock price targets for OfficeDepot ODP are 27.61 and 27.93 | Monthly Target 1 | 27.51 | | Monthly Target 2 | 27.7 | | Monthly Target 3 | 27.833333333333 | | Monthly Target 4 | 28.02 | | Monthly Target 5 | 28.15 |
Monthly price and volumes Office Depot
| Date |
Closing |
Open |
Range |
Volume |
Fri 31 October 2025 |
27.88 (0.11%) |
27.89 |
27.65 - 27.97 |
1.6057 times |
Tue 30 September 2025 |
27.85 (37.46%) |
19.90 |
19.52 - 28.04 |
1.6871 times |
Fri 29 August 2025 |
20.26 (13.57%) |
17.68 |
16.55 - 21.92 |
0.6941 times |
Thu 31 July 2025 |
17.84 (-1.6%) |
18.05 |
16.82 - 20.04 |
0.675 times |
Mon 30 June 2025 |
18.13 (10.21%) |
16.42 |
16.08 - 18.78 |
0.658 times |
Fri 30 May 2025 |
16.45 (20.25%) |
13.83 |
13.57 - 19.65 |
0.8004 times |
Wed 30 April 2025 |
13.68 (-4.54%) |
14.31 |
11.85 - 15.07 |
1.4637 times |
Mon 31 March 2025 |
14.33 (-7.9%) |
15.48 |
13.89 - 17.95 |
0.9885 times |
Fri 28 February 2025 |
15.56 (-31.15%) |
22.01 |
13.44 - 22.65 |
0.7687 times |
Fri 31 January 2025 |
22.60 (-0.62%) |
23.02 |
21.52 - 25.16 |
0.6587 times |
Tue 31 December 2024 |
22.74 (-13.11%) |
26.29 |
21.66 - 28.83 |
0.6597 times |
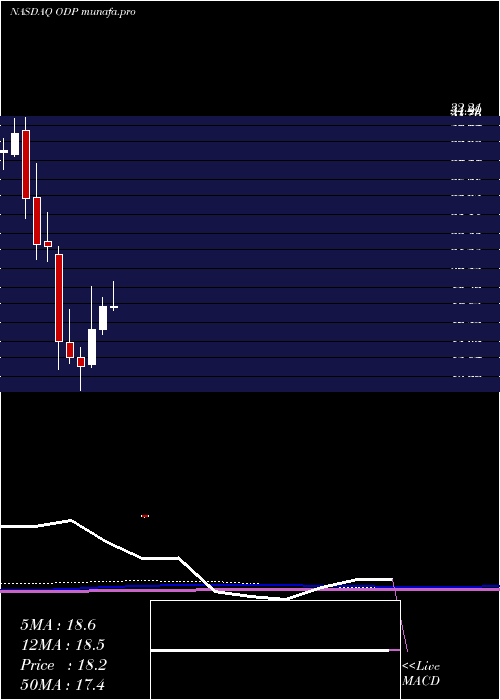
DMA SMA EMA moving averages of Office Depot ODP
DMA (daily moving average) of Office Depot ODP
| DMA period | DMA value | | 5 day DMA | 27.81 | | 12 day DMA | 27.79 | | 20 day DMA | 27.79 | | 35 day DMA | 26.88 | | 50 day DMA | 25.07 | | 100 day DMA | 21.84 | | 150 day DMA | 19.59 | | 200 day DMA | 19.39 | EMA (exponential moving average) of Office Depot ODP
| EMA period | EMA current | EMA prev | EMA prev2 | | 5 day EMA | 27.82 | 27.79 | 27.78 | | 12 day EMA | 27.76 | 27.74 | 27.73 | | 20 day EMA | 27.46 | 27.42 | 27.38 | | 35 day EMA | 26.24 | 26.14 | 26.04 | | 50 day EMA | 24.98 | 24.86 | 24.74 |
SMA (simple moving average) of Office Depot ODP
| SMA period | SMA current | SMA prev | SMA prev2 | | 5 day SMA | 27.81 | 27.79 | 27.78 | | 12 day SMA | 27.79 | 27.8 | 27.8 | | 20 day SMA | 27.79 | 27.79 | 27.79 | | 35 day SMA | 26.88 | 26.67 | 26.49 | | 50 day SMA | 25.07 | 24.94 | 24.78 | | 100 day SMA | 21.84 | 21.74 | 21.64 | | 150 day SMA | 19.59 | 19.5 | 19.41 | | 200 day SMA | 19.39 | 19.37 | 19.36 |
|
|
