NewYork NYMTN full analysis,charts,indicators,moving averages,SMA,DMA,EMA,ADX,MACD,RSINew York NYMTN WideScreen charts, DMA,SMA,EMA technical analysis, forecast prediction, by indicators ADX,MACD,RSI,CCI NASDAQ stock exchange
operates under Consumer Services sector & deals in Real Estate Investment Trusts
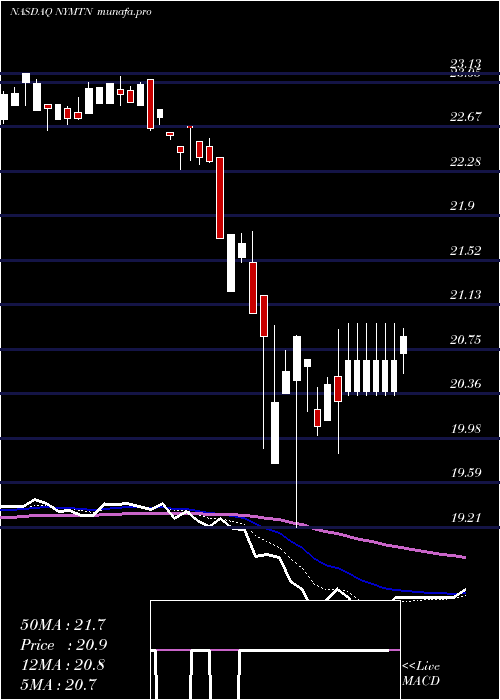
Daily price and charts and targets NewYork Strong Daily Stock price targets for NewYork NYMTN are 21.47 and 21.71 | Daily Target 1 | 21.42 | | Daily Target 2 | 21.52 | | Daily Target 3 | 21.66 | | Daily Target 4 | 21.76 | | Daily Target 5 | 21.9 |
Daily price and volume New York
| Date |
Closing |
Open |
Range |
Volume |
Fri 29 August 2025 |
21.62 (0%) |
21.78 |
21.56 - 21.80 |
0.9537 times |
Thu 28 August 2025 |
21.62 (0.05%) |
21.65 |
21.60 - 21.69 |
0.8836 times |
Wed 27 August 2025 |
21.61 (-0.14%) |
21.71 |
21.61 - 21.73 |
0.6802 times |
Tue 26 August 2025 |
21.64 (0%) |
21.70 |
21.61 - 21.70 |
0.4628 times |
Mon 25 August 2025 |
21.64 (-0.51%) |
21.74 |
21.61 - 21.75 |
0.3927 times |
Fri 22 August 2025 |
21.75 (0.46%) |
21.61 |
21.61 - 21.86 |
0.7504 times |
Thu 21 August 2025 |
21.65 (0.05%) |
21.70 |
21.61 - 21.70 |
1.0589 times |
Wed 20 August 2025 |
21.64 (-0.05%) |
21.73 |
21.60 - 21.80 |
1.1641 times |
Tue 19 August 2025 |
21.65 (-0.46%) |
21.83 |
21.60 - 21.83 |
2.4404 times |
Mon 18 August 2025 |
21.75 (0%) |
21.84 |
21.64 - 21.87 |
1.2132 times |
Fri 15 August 2025 |
21.75 (0.09%) |
21.83 |
21.75 - 21.89 |
0.0561 times |
Weekly price and charts NewYork Strong weekly Stock price targets for NewYork NYMTN are 21.47 and 21.71 | Weekly Target 1 | 21.42 | | Weekly Target 2 | 21.52 | | Weekly Target 3 | 21.66 | | Weekly Target 4 | 21.76 | | Weekly Target 5 | 21.9 |
Weekly price and volumes for New York
| Date |
Closing |
Open |
Range |
Volume |
Fri 29 August 2025 |
21.62 (-0.6%) |
21.74 |
21.56 - 21.80 |
0.5564 times |
Fri 22 August 2025 |
21.75 (0%) |
21.84 |
21.60 - 21.87 |
1.0932 times |
Fri 15 August 2025 |
21.75 (0.97%) |
21.68 |
21.57 - 21.90 |
0.472 times |
Fri 08 August 2025 |
21.54 (-0.92%) |
21.76 |
21.53 - 21.93 |
1.1904 times |
Fri 01 August 2025 |
21.74 (0.6%) |
21.61 |
21.45 - 21.84 |
2.4941 times |
Fri 25 July 2025 |
21.61 (0.28%) |
21.66 |
21.50 - 21.71 |
0.3563 times |
Fri 18 July 2025 |
21.55 (0.47%) |
21.45 |
21.36 - 21.80 |
0.9237 times |
Fri 11 July 2025 |
21.45 (2.48%) |
20.92 |
20.88 - 21.50 |
0.7785 times |
Thu 03 July 2025 |
20.93 (-2.42%) |
21.50 |
20.53 - 21.50 |
1.6461 times |
Fri 27 June 2025 |
21.45 (0.19%) |
21.42 |
21.28 - 21.50 |
0.4893 times |
Fri 20 June 2025 |
21.41 (-0.09%) |
21.45 |
20.72 - 21.53 |
0.6837 times |

Monthly price and charts NewYork Strong monthly Stock price targets for NewYork NYMTN are 21.56 and 21.99 | Monthly Target 1 | 21.25 | | Monthly Target 2 | 21.44 | | Monthly Target 3 | 21.683333333333 | | Monthly Target 4 | 21.87 | | Monthly Target 5 | 22.11 |
Monthly price and volumes New York
| Date |
Closing |
Open |
Range |
Volume |
Fri 29 August 2025 |
21.62 (-0.51%) |
21.50 |
21.50 - 21.93 |
1.3373 times |
Thu 31 July 2025 |
21.73 (4.17%) |
20.53 |
20.53 - 21.84 |
1.8825 times |
Mon 30 June 2025 |
20.86 (-3.52%) |
21.75 |
20.72 - 21.94 |
1.3337 times |
Fri 30 May 2025 |
21.62 (0.32%) |
21.41 |
21.00 - 22.60 |
0.8634 times |
Wed 30 April 2025 |
21.55 (-0.69%) |
21.25 |
19.21 - 21.76 |
0.9184 times |
Mon 31 March 2025 |
21.70 (-6.18%) |
22.81 |
21.70 - 23.10 |
0.6012 times |
Fri 28 February 2025 |
23.13 (3.17%) |
22.23 |
22.23 - 23.13 |
0.8788 times |
Fri 31 January 2025 |
22.42 (-1.32%) |
22.76 |
21.55 - 22.94 |
0.8273 times |
Tue 31 December 2024 |
22.72 (0.18%) |
22.46 |
21.97 - 22.89 |
0.6004 times |
Tue 26 November 2024 |
22.68 (-1.61%) |
22.98 |
22.29 - 23.17 |
0.7571 times |
Thu 31 October 2024 |
23.05 (-1.07%) |
21.87 |
21.87 - 23.56 |
0.9869 times |

DMA SMA EMA moving averages of New York NYMTN
DMA (daily moving average) of New York NYMTN
| DMA period | DMA value | | 5 day DMA | 21.63 | | 12 day DMA | 21.67 | | 20 day DMA | 21.67 | | 35 day DMA | 21.62 | | 50 day DMA | 21.5 | | 100 day DMA | 21.46 | | 150 day DMA | 21.81 | | 200 day DMA | 21.99 | EMA (exponential moving average) of New York NYMTN
| EMA period | EMA current | EMA prev | EMA prev2 | | 5 day EMA | 21.63 | 21.64 | 21.65 | | 12 day EMA | 21.65 | 21.65 | 21.66 | | 20 day EMA | 21.65 | 21.65 | 21.65 | | 35 day EMA | 21.57 | 21.57 | 21.57 | | 50 day EMA | 21.51 | 21.51 | 21.51 |
SMA (simple moving average) of New York NYMTN
| SMA period | SMA current | SMA prev | SMA prev2 | | 5 day SMA | 21.63 | 21.65 | 21.66 | | 12 day SMA | 21.67 | 21.69 | 21.69 | | 20 day SMA | 21.67 | 21.68 | 21.67 | | 35 day SMA | 21.62 | 21.62 | 21.61 | | 50 day SMA | 21.5 | 21.49 | 21.49 | | 100 day SMA | 21.46 | 21.45 | 21.44 | | 150 day SMA | 21.81 | 21.82 | 21.82 | | 200 day SMA | 21.99 | 22 | 22 |
|
|
