NewYork NYMT full analysis,charts,indicators,moving averages,SMA,DMA,EMA,ADX,MACD,RSINew York NYMT WideScreen charts, DMA,SMA,EMA technical analysis, forecast prediction, by indicators ADX,MACD,RSI,CCI NASDAQ stock exchange
operates under Consumer Services sector & deals in Real Estate Investment Trusts
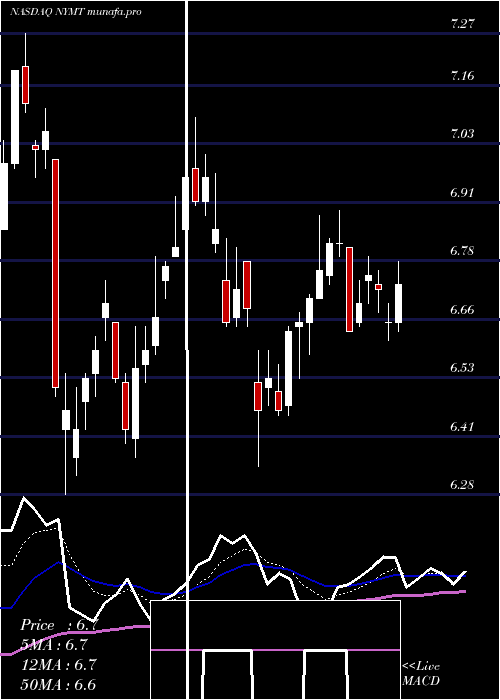
Daily price and charts and targets NewYork Strong Daily Stock price targets for NewYork NYMT are 7.15 and 7.31 | Daily Target 1 | 7.01 | | Daily Target 2 | 7.12 | | Daily Target 3 | 7.1733333333333 | | Daily Target 4 | 7.28 | | Daily Target 5 | 7.33 |
Daily price and volume New York
| Date |
Closing |
Open |
Range |
Volume |
Fri 29 August 2025 |
7.22 (2.27%) |
7.08 |
7.07 - 7.23 |
0.8335 times |
Thu 28 August 2025 |
7.06 (-0.56%) |
7.12 |
7.05 - 7.12 |
0.722 times |
Wed 27 August 2025 |
7.10 (-0.84%) |
7.13 |
7.05 - 7.20 |
0.9232 times |
Tue 26 August 2025 |
7.16 (0.85%) |
7.08 |
7.08 - 7.16 |
0.6797 times |
Mon 25 August 2025 |
7.10 (-0.56%) |
7.12 |
7.01 - 7.14 |
1.071 times |
Fri 22 August 2025 |
7.14 (3.48%) |
6.96 |
6.92 - 7.21 |
1.655 times |
Thu 21 August 2025 |
6.90 (-1.99%) |
6.99 |
6.90 - 7.05 |
1.1574 times |
Wed 20 August 2025 |
7.04 (1.73%) |
6.93 |
6.92 - 7.11 |
1.4553 times |
Tue 19 August 2025 |
6.92 (1.47%) |
6.84 |
6.83 - 7.00 |
0.9171 times |
Mon 18 August 2025 |
6.82 (-0.29%) |
6.86 |
6.79 - 6.89 |
0.5859 times |
Fri 15 August 2025 |
6.84 (0.15%) |
6.84 |
6.82 - 6.91 |
0.7349 times |
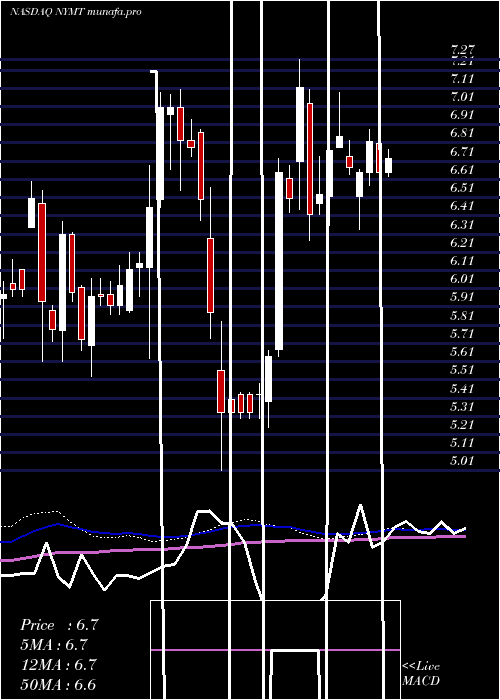
Weekly price and charts NewYork Strong weekly Stock price targets for NewYork NYMT are 7.12 and 7.34 | Weekly Target 1 | 6.93 | | Weekly Target 2 | 7.08 | | Weekly Target 3 | 7.1533333333333 | | Weekly Target 4 | 7.3 | | Weekly Target 5 | 7.37 |
Weekly price and volumes for New York
| Date |
Closing |
Open |
Range |
Volume |
Fri 29 August 2025 |
7.22 (1.12%) |
7.12 |
7.01 - 7.23 |
0.7322 times |
Fri 22 August 2025 |
7.14 (4.39%) |
6.86 |
6.79 - 7.21 |
0.999 times |
Fri 15 August 2025 |
6.84 (3.01%) |
6.67 |
6.57 - 6.95 |
0.9732 times |
Fri 08 August 2025 |
6.64 (0.91%) |
6.72 |
6.48 - 6.76 |
0.7918 times |
Fri 01 August 2025 |
6.58 (-6.13%) |
7.05 |
6.16 - 7.07 |
1.8626 times |
Fri 25 July 2025 |
7.01 (4.78%) |
6.73 |
6.70 - 7.05 |
1.0772 times |
Fri 18 July 2025 |
6.69 (0.6%) |
6.65 |
6.60 - 6.83 |
0.965 times |
Fri 11 July 2025 |
6.65 (-2.49%) |
6.81 |
6.61 - 6.81 |
0.6873 times |
Thu 03 July 2025 |
6.82 (2.56%) |
6.65 |
6.58 - 6.89 |
0.6236 times |
Fri 27 June 2025 |
6.65 (-0.45%) |
6.52 |
6.34 - 6.67 |
1.2882 times |
Fri 20 June 2025 |
6.68 (-2.48%) |
6.74 |
6.64 - 6.83 |
1.21 times |
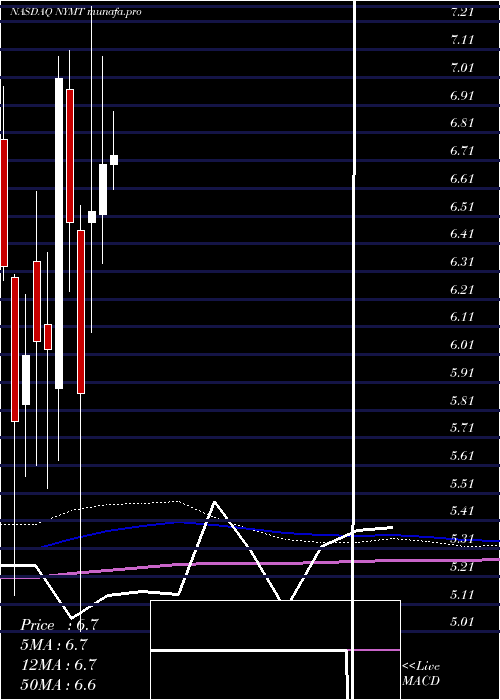
Monthly price and charts NewYork Strong monthly Stock price targets for NewYork NYMT are 6.74 and 7.72 | Monthly Target 1 | 5.92 | | Monthly Target 2 | 6.57 | | Monthly Target 3 | 6.9 | | Monthly Target 4 | 7.55 | | Monthly Target 5 | 7.88 |
Monthly price and volumes New York
| Date |
Closing |
Open |
Range |
Volume |
Fri 29 August 2025 |
7.22 (14.06%) |
6.32 |
6.25 - 7.23 |
0.839 times |
Thu 31 July 2025 |
6.33 (-5.52%) |
6.70 |
6.16 - 7.07 |
0.9267 times |
Mon 30 June 2025 |
6.70 (2.6%) |
6.52 |
6.34 - 7.09 |
0.9386 times |
Fri 30 May 2025 |
6.53 (11.24%) |
6.49 |
6.09 - 7.27 |
1.162 times |
Wed 30 April 2025 |
5.87 (-9.55%) |
6.46 |
5.01 - 6.55 |
1.1314 times |
Mon 31 March 2025 |
6.49 (-7.42%) |
6.97 |
6.24 - 7.11 |
1.0259 times |
Fri 28 February 2025 |
7.01 (16.25%) |
5.89 |
5.63 - 7.09 |
0.9671 times |
Fri 31 January 2025 |
6.03 (-0.5%) |
6.12 |
5.53 - 6.38 |
0.8638 times |
Tue 31 December 2024 |
6.06 (0.83%) |
6.35 |
5.61 - 6.60 |
1.0596 times |
Tue 26 November 2024 |
6.01 (4.16%) |
5.83 |
5.57 - 6.23 |
1.0859 times |
Thu 31 October 2024 |
5.77 (-8.85%) |
6.29 |
5.14 - 6.30 |
1.1983 times |
DMA SMA EMA moving averages of New York NYMT
DMA (daily moving average) of New York NYMT
| DMA period | DMA value | | 5 day DMA | 7.13 | | 12 day DMA | 7.01 | | 20 day DMA | 6.88 | | 35 day DMA | 6.83 | | 50 day DMA | 6.78 | | 100 day DMA | 6.53 | | 150 day DMA | 6.49 | | 200 day DMA | 6.37 | EMA (exponential moving average) of New York NYMT
| EMA period | EMA current | EMA prev | EMA prev2 | | 5 day EMA | 7.12 | 7.07 | 7.08 | | 12 day EMA | 7.03 | 6.99 | 6.98 | | 20 day EMA | 6.95 | 6.92 | 6.91 | | 35 day EMA | 6.88 | 6.86 | 6.85 | | 50 day EMA | 6.83 | 6.81 | 6.8 |
SMA (simple moving average) of New York NYMT
| SMA period | SMA current | SMA prev | SMA prev2 | | 5 day SMA | 7.13 | 7.11 | 7.08 | | 12 day SMA | 7.01 | 6.99 | 6.96 | | 20 day SMA | 6.88 | 6.83 | 6.82 | | 35 day SMA | 6.83 | 6.82 | 6.81 | | 50 day SMA | 6.78 | 6.77 | 6.77 | | 100 day SMA | 6.53 | 6.51 | 6.5 | | 150 day SMA | 6.49 | 6.49 | 6.48 | | 200 day SMA | 6.37 | 6.36 | 6.36 |
|
|
