NutraceuticalInternational NUTR full analysis,charts,indicators,moving averages,SMA,DMA,EMA,ADX,MACD,RSINutraceutical International NUTR WideScreen charts, DMA,SMA,EMA technical analysis, forecast prediction, by indicators ADX,MACD,RSI,CCI NASDAQ stock exchange
operates under Consumer Durables sector & deals in Specialty Chemicals
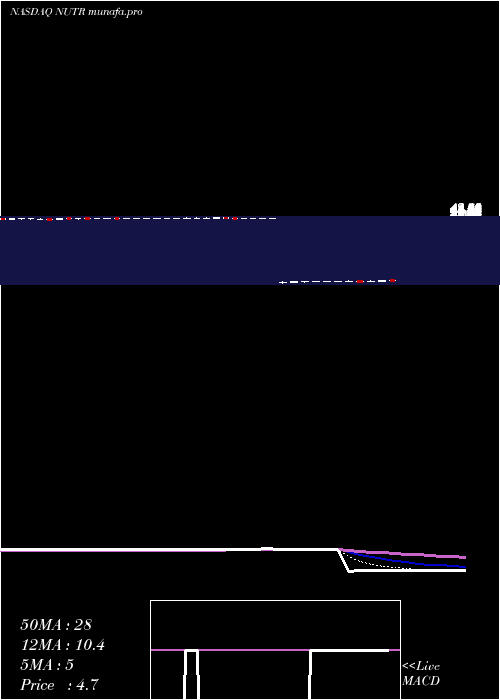
Daily price and charts and targets NutraceuticalInternational Strong Daily Stock price targets for NutraceuticalInternational NUTR are 4.48 and 4.69 | Daily Target 1 | 4.42 | | Daily Target 2 | 4.54 | | Daily Target 3 | 4.6266666666667 | | Daily Target 4 | 4.75 | | Daily Target 5 | 4.84 |
Daily price and volume Nutraceutical International
| Date |
Closing |
Open |
Range |
Volume |
Fri 29 August 2025 |
4.67 (-0.85%) |
4.71 |
4.50 - 4.71 |
0.3995 times |
Thu 28 August 2025 |
4.71 (2.84%) |
4.55 |
4.31 - 4.72 |
0.5183 times |
Wed 27 August 2025 |
4.58 (2.46%) |
4.39 |
4.21 - 4.62 |
0.6079 times |
Tue 26 August 2025 |
4.47 (-1.32%) |
4.57 |
4.35 - 4.57 |
0.5218 times |
Mon 25 August 2025 |
4.53 (2.26%) |
4.40 |
4.40 - 4.69 |
0.5408 times |
Fri 22 August 2025 |
4.43 (2.07%) |
4.41 |
4.30 - 4.49 |
0.6279 times |
Thu 21 August 2025 |
4.34 (0.93%) |
4.34 |
4.20 - 4.40 |
3.3828 times |
Wed 20 August 2025 |
4.30 (2.14%) |
4.20 |
4.12 - 4.40 |
1.306 times |
Tue 19 August 2025 |
4.21 (2.68%) |
4.16 |
3.95 - 4.39 |
1.4396 times |
Mon 18 August 2025 |
4.10 (4.86%) |
3.95 |
3.90 - 4.18 |
0.6553 times |
Fri 15 August 2025 |
3.91 (-90.65%) |
3.58 |
3.40 - 4.07 |
4.2776 times |
Weekly price and charts NutraceuticalInternational Strong weekly Stock price targets for NutraceuticalInternational NUTR are 4.44 and 4.95 | Weekly Target 1 | 4.02 | | Weekly Target 2 | 4.35 | | Weekly Target 3 | 4.5333333333333 | | Weekly Target 4 | 4.86 | | Weekly Target 5 | 5.04 |
Weekly price and volumes for Nutraceutical International
| Date |
Closing |
Open |
Range |
Volume |
Fri 29 August 2025 |
4.67 (5.42%) |
4.40 |
4.21 - 4.72 |
1.3607 times |
Fri 22 August 2025 |
4.43 (13.3%) |
3.95 |
3.90 - 4.49 |
3.8964 times |
Fri 15 August 2025 |
3.91 (-90.65%) |
41.75 |
3.40 - 41.85 |
2.3879 times |
Fri 18 August 2017 |
41.80 (-0.95%) |
42.15 |
41.75 - 42.45 |
0.1843 times |
Fri 11 August 2017 |
42.20 (0.84%) |
41.85 |
41.80 - 42.35 |
0.5286 times |
Fri 04 August 2017 |
41.85 (0.24%) |
41.70 |
41.70 - 41.90 |
0.525 times |
Fri 28 July 2017 |
41.75 (0.24%) |
41.65 |
41.60 - 41.98 |
0.4439 times |
Fri 21 July 2017 |
41.65 (-0.12%) |
41.65 |
41.55 - 41.75 |
0.2668 times |
Fri 14 July 2017 |
41.70 (0%) |
41.65 |
41.60 - 42.03 |
0.2435 times |
Fri 07 July 2017 |
41.70 (0.12%) |
41.65 |
41.60 - 41.70 |
0.1628 times |
Fri 30 June 2017 |
41.65 (-0.12%) |
41.70 |
41.60 - 41.80 |
0.1806 times |

Monthly price and charts NutraceuticalInternational Strong monthly Stock price targets for NutraceuticalInternational NUTR are -15.49 and 23.56 | Monthly Target 1 | -22.21 | | Monthly Target 2 | -8.77 | | Monthly Target 3 | 16.84 | | Monthly Target 4 | 30.28 | | Monthly Target 5 | 55.89 |
Monthly price and volumes Nutraceutical International
| Date |
Closing |
Open |
Range |
Volume |
Fri 29 August 2025 |
4.67 (-88.83%) |
41.75 |
3.40 - 42.45 |
6.0897 times |
Mon 31 July 2017 |
41.80 (0.36%) |
41.65 |
41.55 - 42.03 |
0.7957 times |
Fri 30 June 2017 |
41.65 (-0.24%) |
41.75 |
41.55 - 41.85 |
0.7662 times |
Wed 31 May 2017 |
41.75 (31.7%) |
31.80 |
28.00 - 42.40 |
0.993 times |
Fri 28 April 2017 |
31.70 (1.77%) |
31.05 |
28.60 - 32.65 |
0.217 times |
Fri 31 March 2017 |
31.15 (-7.57%) |
34.20 |
31.00 - 34.85 |
0.2037 times |
Tue 28 February 2017 |
33.70 (0.6%) |
33.50 |
33.30 - 35.52 |
0.2237 times |
Tue 31 January 2017 |
33.50 (-4.15%) |
35.25 |
33.30 - 37.90 |
0.2135 times |
Fri 30 December 2016 |
34.95 (8.37%) |
32.45 |
31.50 - 36.15 |
0.2763 times |
Wed 30 November 2016 |
32.25 (11.98%) |
27.95 |
27.90 - 33.35 |
0.2213 times |
Mon 31 October 2016 |
28.80 (-7.81%) |
31.07 |
28.80 - 31.55 |
0.1431 times |

DMA SMA EMA moving averages of Nutraceutical International NUTR
DMA (daily moving average) of Nutraceutical International NUTR
| DMA period | DMA value | | 5 day DMA | 4.59 | | 12 day DMA | 7.5 | | 20 day DMA | 21.28 | | 35 day DMA | 30.07 | | 50 day DMA | 33.54 | | 100 day DMA | 34.82 | | 150 day DMA | 34.17 | | 200 day DMA | 34.16 | EMA (exponential moving average) of Nutraceutical International NUTR
| EMA period | EMA current | EMA prev | EMA prev2 | | 5 day EMA | 5.02 | 5.2 | 5.45 | | 12 day EMA | 10.44 | 11.49 | 12.72 | | 20 day EMA | 16.89 | 18.18 | 19.6 | | 35 day EMA | 24.34 | 25.5 | 26.72 | | 50 day EMA | 31.33 | 32.42 | 33.55 |
SMA (simple moving average) of Nutraceutical International NUTR
| SMA period | SMA current | SMA prev | SMA prev2 | | 5 day SMA | 4.59 | 4.54 | 4.47 | | 12 day SMA | 7.5 | 10.59 | 13.69 | | 20 day SMA | 21.28 | 23.15 | 25.02 | | 35 day SMA | 30.07 | 31.12 | 32.18 | | 50 day SMA | 33.54 | 34.28 | 35.02 | | 100 day SMA | 34.82 | 35.08 | 35.34 | | 150 day SMA | 34.17 | 34.37 | 34.56 | | 200 day SMA | 34.16 | 34.29 | 34.42 |
|
|
