NeurometrixInc NURO full analysis,charts,indicators,moving averages,SMA,DMA,EMA,ADX,MACD,RSINeurometrix Inc NURO WideScreen charts, DMA,SMA,EMA technical analysis, forecast prediction, by indicators ADX,MACD,RSI,CCI NASDAQ stock exchange
operates under Health Care sector & deals in Medical Dental Instruments
Daily price and charts and targets NeurometrixInc Strong Daily Stock price targets for NeurometrixInc NURO are 4.46 and 4.82 | Daily Target 1 | 4.17 | | Daily Target 2 | 4.38 | | Daily Target 3 | 4.5333333333333 | | Daily Target 4 | 4.74 | | Daily Target 5 | 4.89 |
Daily price and volume Neurometrix Inc
| Date |
Closing |
Open |
Range |
Volume |
Thu 01 May 2025 |
4.58 (5.05%) |
4.36 |
4.33 - 4.69 |
5.2911 times |
Wed 30 April 2025 |
4.36 (0%) |
4.34 |
4.34 - 4.37 |
0.2683 times |
Tue 29 April 2025 |
4.36 (0%) |
4.26 |
4.26 - 4.40 |
3.1001 times |
Mon 28 April 2025 |
4.36 (0.46%) |
4.45 |
4.33 - 4.45 |
0.3428 times |
Fri 25 April 2025 |
4.34 (-0.23%) |
4.38 |
4.33 - 4.41 |
0.1938 times |
Tue 22 April 2025 |
4.35 (0.69%) |
4.28 |
4.28 - 4.38 |
0.0894 times |
Mon 21 April 2025 |
4.32 (-2.26%) |
4.30 |
4.30 - 4.34 |
0.5068 times |
Thu 17 April 2025 |
4.42 (1.84%) |
4.28 |
4.28 - 4.43 |
0.2078 times |
Wed 16 April 2025 |
4.34 (0%) |
4.33 |
4.33 - 4.34 |
0 times |
Wed 16 April 2025 |
4.34 (0%) |
4.33 |
4.33 - 4.34 |
0 times |
Wed 16 April 2025 |
4.34 (0%) |
4.32 |
4.32 - 4.34 |
0.0988 times |
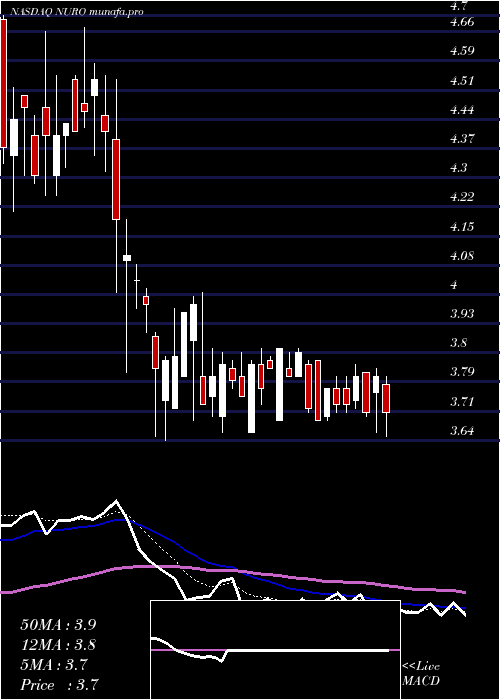
Weekly price and charts NeurometrixInc Strong weekly Stock price targets for NeurometrixInc NURO are 4.42 and 4.85 | Weekly Target 1 | 4.08 | | Weekly Target 2 | 4.33 | | Weekly Target 3 | 4.51 | | Weekly Target 4 | 4.76 | | Weekly Target 5 | 4.94 |
Weekly price and volumes for Neurometrix Inc
| Date |
Closing |
Open |
Range |
Volume |
Thu 01 May 2025 |
4.58 (5.53%) |
4.45 |
4.26 - 4.69 |
5.5181 times |
Fri 25 April 2025 |
4.34 (-1.81%) |
4.30 |
4.28 - 4.41 |
0.4842 times |
Thu 17 April 2025 |
4.42 (1.84%) |
4.33 |
4.28 - 4.43 |
0.1274 times |
Wed 16 April 2025 |
4.34 (0%) |
4.33 |
4.33 - 4.34 |
0 times |
Wed 16 April 2025 |
4.34 (0%) |
4.32 |
4.32 - 4.34 |
0.0606 times |
Wed 16 April 2025 |
4.34 (0%) |
4.33 |
4.33 - 4.34 |
0 times |
Wed 16 April 2025 |
4.34 (0%) |
4.33 |
4.33 - 4.34 |
0 times |
Wed 16 April 2025 |
4.34 (-1.59%) |
4.42 |
4.32 - 4.42 |
0.1553 times |
Thu 10 April 2025 |
4.41 (0%) |
4.32 |
4.26 - 4.45 |
1.5988 times |
Fri 04 April 2025 |
4.41 (-0.45%) |
4.40 |
4.38 - 4.50 |
2.0556 times |
Fri 28 March 2025 |
4.43 (-1.77%) |
4.51 |
4.42 - 4.65 |
1.1237 times |
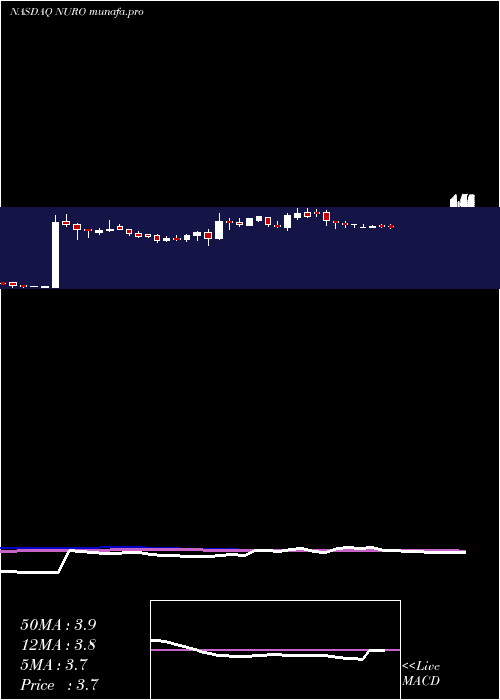
Monthly price and charts NeurometrixInc Strong monthly Stock price targets for NeurometrixInc NURO are 4.46 and 4.82 | Monthly Target 1 | 4.17 | | Monthly Target 2 | 4.38 | | Monthly Target 3 | 4.5333333333333 | | Monthly Target 4 | 4.74 | | Monthly Target 5 | 4.89 |
Monthly price and volumes Neurometrix Inc
| Date |
Closing |
Open |
Range |
Volume |
Thu 01 May 2025 |
4.58 (5.05%) |
4.36 |
4.33 - 4.69 |
0.1149 times |
Wed 30 April 2025 |
4.36 (-1.36%) |
4.41 |
4.26 - 4.45 |
0.2277 times |
Mon 31 March 2025 |
4.42 (0.91%) |
4.36 |
4.33 - 4.65 |
0.3118 times |
Fri 28 February 2025 |
4.38 (1.62%) |
4.35 |
4.16 - 4.54 |
0.5738 times |
Fri 31 January 2025 |
4.31 (8.56%) |
3.97 |
3.86 - 4.39 |
1.4912 times |
Tue 31 December 2024 |
3.97 (-6.59%) |
4.28 |
3.63 - 4.28 |
1.7365 times |
Tue 26 November 2024 |
4.25 (5.99%) |
4.01 |
3.22 - 4.73 |
1.2641 times |
Thu 31 October 2024 |
4.01 (1.01%) |
3.93 |
3.80 - 4.70 |
1.0382 times |
Mon 30 September 2024 |
3.97 (3.93%) |
3.93 |
3.63 - 4.27 |
1.3834 times |
Fri 30 August 2024 |
3.82 (4.95%) |
3.51 |
2.66 - 4.05 |
1.8583 times |
Wed 31 July 2024 |
3.64 (-1.36%) |
3.73 |
3.50 - 4.10 |
0.7002 times |

DMA SMA EMA moving averages of Neurometrix Inc NURO
DMA (daily moving average) of Neurometrix Inc NURO
| DMA period | DMA value | | 5 day DMA | 4.4 | | 12 day DMA | 4.37 | | 20 day DMA | 4.37 | | 35 day DMA | 4.4 | | 50 day DMA | 4.39 | | 100 day DMA | 4.24 | | 150 day DMA | 4.18 | | 200 day DMA | 4.04 | EMA (exponential moving average) of Neurometrix Inc NURO
| EMA period | EMA current | EMA prev | EMA prev2 | | 5 day EMA | 4.43 | 4.35 | 4.35 | | 12 day EMA | 4.4 | 4.37 | 4.37 | | 20 day EMA | 4.4 | 4.38 | 4.38 | | 35 day EMA | 4.41 | 4.4 | 4.4 | | 50 day EMA | 4.4 | 4.39 | 4.39 |
SMA (simple moving average) of Neurometrix Inc NURO
| SMA period | SMA current | SMA prev | SMA prev2 | | 5 day SMA | 4.4 | 4.35 | 4.35 | | 12 day SMA | 4.37 | 4.35 | 4.35 | | 20 day SMA | 4.37 | 4.36 | 4.36 | | 35 day SMA | 4.4 | 4.39 | 4.39 | | 50 day SMA | 4.39 | 4.39 | 4.39 | | 100 day SMA | 4.24 | 4.24 | 4.24 | | 150 day SMA | 4.18 | 4.18 | 4.17 | | 200 day SMA | 4.04 | 4.04 | 4.03 |
|
|
