MerusN MRUS full analysis,charts,indicators,moving averages,SMA,DMA,EMA,ADX,MACD,RSIMerus N MRUS WideScreen charts, DMA,SMA,EMA technical analysis, forecast prediction, by indicators ADX,MACD,RSI,CCI NASDAQ stock exchange
operates under Health Care sector & deals in Major Pharmaceuticals
Daily price and charts and targets MerusN Strong Daily Stock price targets for MerusN MRUS are 96.92 and 97.24 | Daily Target 1 | 96.67 | | Daily Target 2 | 96.84 | | Daily Target 3 | 96.99 | | Daily Target 4 | 97.16 | | Daily Target 5 | 97.31 |
Daily price and volume Merus N
| Date |
Closing |
Open |
Range |
Volume |
Fri 19 December 2025 |
97.01 (0.22%) |
96.93 |
96.82 - 97.14 |
0.7406 times |
Thu 18 December 2025 |
96.80 (-0.09%) |
96.95 |
96.78 - 96.96 |
0.6655 times |
Wed 17 December 2025 |
96.89 (-0.03%) |
96.95 |
96.85 - 96.99 |
1.2117 times |
Tue 16 December 2025 |
96.92 (0.1%) |
96.77 |
96.73 - 96.98 |
1.0552 times |
Mon 15 December 2025 |
96.82 (-0.11%) |
96.87 |
96.69 - 96.93 |
0.7384 times |
Fri 12 December 2025 |
96.93 (0.31%) |
96.80 |
96.80 - 96.94 |
0.5733 times |
Thu 11 December 2025 |
96.63 (-0.14%) |
96.77 |
96.60 - 96.79 |
0.8928 times |
Wed 10 December 2025 |
96.77 (0.43%) |
96.65 |
96.65 - 96.83 |
2.5349 times |
Tue 09 December 2025 |
96.36 (0.09%) |
96.25 |
96.25 - 96.42 |
1.1104 times |
Mon 08 December 2025 |
96.27 (0.14%) |
96.20 |
96.11 - 96.34 |
0.4772 times |
Fri 05 December 2025 |
96.14 (-0.08%) |
96.20 |
96.09 - 96.25 |
0.5695 times |
Weekly price and charts MerusN Strong weekly Stock price targets for MerusN MRUS are 96.85 and 97.3 | Weekly Target 1 | 96.5 | | Weekly Target 2 | 96.75 | | Weekly Target 3 | 96.946666666667 | | Weekly Target 4 | 97.2 | | Weekly Target 5 | 97.4 |
Weekly price and volumes for Merus N
| Date |
Closing |
Open |
Range |
Volume |
Fri 19 December 2025 |
97.01 (0.08%) |
96.87 |
96.69 - 97.14 |
0.886 times |
Fri 12 December 2025 |
96.93 (0.82%) |
96.20 |
96.11 - 96.94 |
1.1224 times |
Fri 05 December 2025 |
96.14 (0%) |
96.14 |
95.83 - 96.27 |
1.0858 times |
Fri 28 November 2025 |
96.14 (0.4%) |
95.80 |
95.80 - 96.19 |
0.6697 times |
Fri 21 November 2025 |
95.76 (-0.2%) |
96.09 |
95.63 - 96.17 |
1.4935 times |
Fri 14 November 2025 |
95.95 (0.76%) |
95.41 |
95.14 - 96.28 |
1.2028 times |
Fri 07 November 2025 |
95.23 (0.39%) |
94.78 |
94.76 - 95.40 |
0.4589 times |
Fri 31 October 2025 |
94.86 (0%) |
95.02 |
94.77 - 95.12 |
0.1763 times |
Fri 31 October 2025 |
94.86 (-0.02%) |
94.87 |
94.59 - 95.30 |
1.1145 times |
Fri 24 October 2025 |
94.88 (-0.01%) |
94.80 |
94.38 - 95.06 |
1.7901 times |
Fri 17 October 2025 |
94.89 (0.55%) |
94.45 |
94.38 - 95.04 |
1.8931 times |
Monthly price and charts MerusN Strong monthly Stock price targets for MerusN MRUS are 96.42 and 97.73 | Monthly Target 1 | 95.35 | | Monthly Target 2 | 96.18 | | Monthly Target 3 | 96.66 | | Monthly Target 4 | 97.49 | | Monthly Target 5 | 97.97 |
Monthly price and volumes Merus N
| Date |
Closing |
Open |
Range |
Volume |
Fri 19 December 2025 |
97.01 (0.9%) |
96.14 |
95.83 - 97.14 |
0.675 times |
Fri 28 November 2025 |
96.14 (1.35%) |
94.78 |
94.76 - 96.28 |
0.8344 times |
Fri 31 October 2025 |
94.86 (0.75%) |
94.36 |
94.01 - 95.30 |
2.1796 times |
Tue 30 September 2025 |
94.15 (43%) |
66.31 |
62.80 - 94.56 |
2.2581 times |
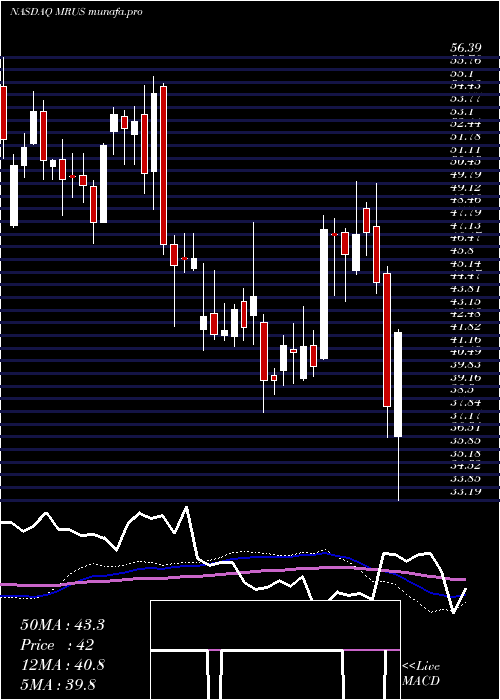
Fri 29 August 2025 |
65.84 (-0.6%) |
65.86 |
62.15 - 69.20 |
0.4506 times |
Thu 31 July 2025 |
66.24 (25.93%) |
52.58 |
51.78 - 67.59 |
0.5213 times |
Mon 30 June 2025 |
52.60 (-6.19%) |
56.61 |
51.84 - 62.98 |
0.8392 times |
Fri 30 May 2025 |
56.07 (23.2%) |
45.71 |
37.92 - 57.66 |
1.1866 times |
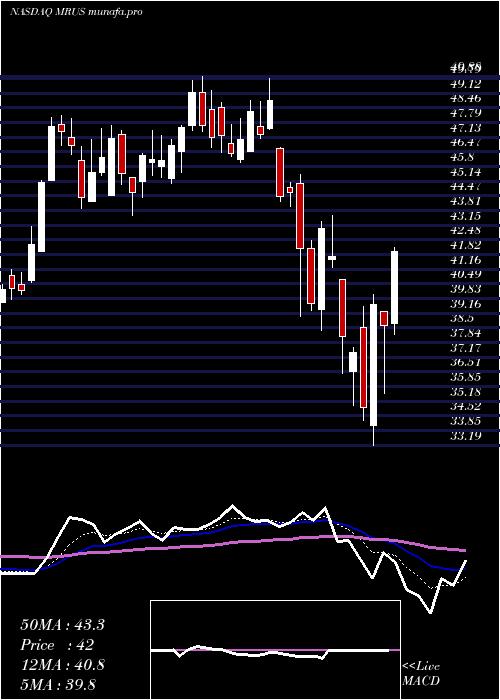
Wed 30 April 2025 |
45.51 (8.13%) |
42.07 |
33.19 - 45.99 |
0.564 times |
Mon 31 March 2025 |
42.09 (-10.62%) |
47.24 |
39.00 - 49.88 |
0.4913 times |
Fri 28 February 2025 |
47.09 (15.02%) |
39.58 |
39.49 - 48.10 |
0.3951 times |

DMA SMA EMA moving averages of Merus N MRUS
DMA (daily moving average) of Merus N MRUS
| DMA period | DMA value | | 5 day DMA | 96.89 | | 12 day DMA | 96.65 | | 20 day DMA | 96.39 | | 35 day DMA | 96.02 | | 50 day DMA | 95.63 | | 100 day DMA | 83.69 | | 150 day DMA | 74.23 | | 200 day DMA | 66.53 | EMA (exponential moving average) of Merus N MRUS
| EMA period | EMA current | EMA prev | EMA prev2 | | 5 day EMA | 96.88 | 96.81 | 96.81 | | 12 day EMA | 96.67 | 96.61 | 96.57 | | 20 day EMA | 96.44 | 96.38 | 96.34 | | 35 day EMA | 96.05 | 95.99 | 95.94 | | 50 day EMA | 95.66 | 95.6 | 95.55 |
SMA (simple moving average) of Merus N MRUS
| SMA period | SMA current | SMA prev | SMA prev2 | | 5 day SMA | 96.89 | 96.87 | 96.84 | | 12 day SMA | 96.65 | 96.57 | 96.51 | | 20 day SMA | 96.39 | 96.34 | 96.3 | | 35 day SMA | 96.02 | 95.97 | 95.91 | | 50 day SMA | 95.63 | 95.58 | 95.54 | | 100 day SMA | 83.69 | 83.38 | 83.08 | | 150 day SMA | 74.23 | 73.85 | 73.47 | | 200 day SMA | 66.53 | 66.27 | 66.01 |
|
|
