MersanaTherapeutics MRSN full analysis,charts,indicators,moving averages,SMA,DMA,EMA,ADX,MACD,RSIMersana Therapeutics MRSN WideScreen charts, DMA,SMA,EMA technical analysis, forecast prediction, by indicators ADX,MACD,RSI,CCI NASDAQ stock exchange
operates under Health Care sector & deals in Major Pharmaceuticals
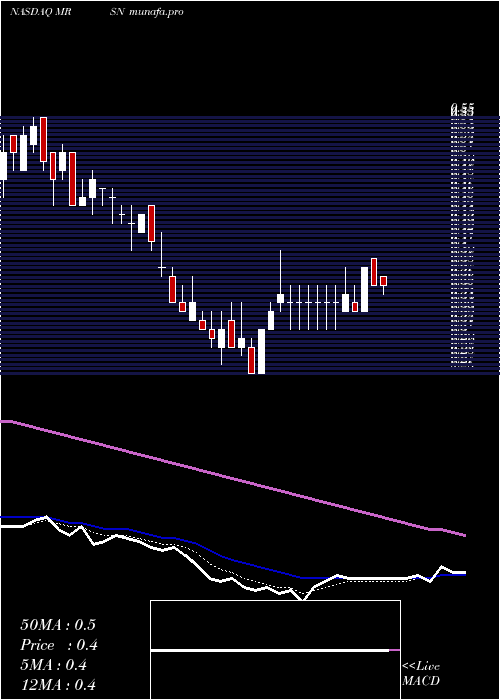
Daily price and charts and targets MersanaTherapeutics Strong Daily Stock price targets for MersanaTherapeutics MRSN are 28.62 and 29.17 | Daily Target 1 | 28.51 | | Daily Target 2 | 28.72 | | Daily Target 3 | 29.056666666667 | | Daily Target 4 | 29.27 | | Daily Target 5 | 29.61 |
Daily price and volume Mersana Therapeutics
| Date |
Closing |
Open |
Range |
Volume |
Fri 19 December 2025 |
28.94 (-0.55%) |
29.29 |
28.84 - 29.39 |
1.3611 times |
Thu 18 December 2025 |
29.10 (0.14%) |
29.03 |
28.72 - 29.10 |
0.6127 times |
Wed 17 December 2025 |
29.06 (0.03%) |
28.56 |
28.55 - 29.20 |
1.8558 times |
Tue 16 December 2025 |
29.05 (1.61%) |
28.43 |
28.38 - 29.12 |
0.9877 times |
Mon 15 December 2025 |
28.59 (0.85%) |
28.28 |
28.28 - 28.80 |
1.0866 times |
Fri 12 December 2025 |
28.35 (0.43%) |
28.38 |
28.11 - 28.70 |
1.2079 times |
Thu 11 December 2025 |
28.23 (0.43%) |
28.11 |
28.10 - 28.41 |
0.533 times |
Wed 10 December 2025 |
28.11 (-0.11%) |
27.91 |
27.90 - 28.59 |
0.967 times |
Tue 09 December 2025 |
28.14 (0.79%) |
27.85 |
27.85 - 28.63 |
0.7292 times |
Mon 08 December 2025 |
27.92 (0.54%) |
28.03 |
27.80 - 28.15 |
0.659 times |
Fri 05 December 2025 |
27.77 (1.09%) |
27.65 |
27.36 - 27.97 |
0.7691 times |
Weekly price and charts MersanaTherapeutics Strong weekly Stock price targets for MersanaTherapeutics MRSN are 28.61 and 29.72 | Weekly Target 1 | 27.76 | | Weekly Target 2 | 28.35 | | Weekly Target 3 | 28.87 | | Weekly Target 4 | 29.46 | | Weekly Target 5 | 29.98 |
Weekly price and volumes for Mersana Therapeutics
| Date |
Closing |
Open |
Range |
Volume |
Fri 19 December 2025 |
28.94 (2.08%) |
28.28 |
28.28 - 29.39 |
0.7306 times |
Fri 12 December 2025 |
28.35 (2.09%) |
28.03 |
27.80 - 28.70 |
0.5068 times |
Fri 05 December 2025 |
27.77 (1.24%) |
27.38 |
27.31 - 28.36 |
0.4824 times |
Fri 28 November 2025 |
27.43 (0.48%) |
27.30 |
27.15 - 27.85 |
0.4707 times |
Fri 21 November 2025 |
27.30 (-2.22%) |
27.60 |
27.22 - 28.05 |
1.1106 times |
Fri 14 November 2025 |
27.92 (231.99%) |
8.50 |
8.26 - 29.89 |
5.5972 times |
Fri 07 November 2025 |
8.41 (-12.21%) |
9.15 |
7.54 - 9.15 |
0.2827 times |
Fri 31 October 2025 |
9.58 (0%) |
9.30 |
9.24 - 9.87 |
0.0691 times |
Fri 31 October 2025 |
9.58 (-2.04%) |
9.90 |
9.24 - 10.64 |
0.3552 times |
Fri 24 October 2025 |
9.78 (-1.01%) |
9.92 |
8.76 - 10.51 |
0.3947 times |
Fri 17 October 2025 |
9.88 (6.93%) |
9.28 |
9.24 - 11.15 |
1.0188 times |
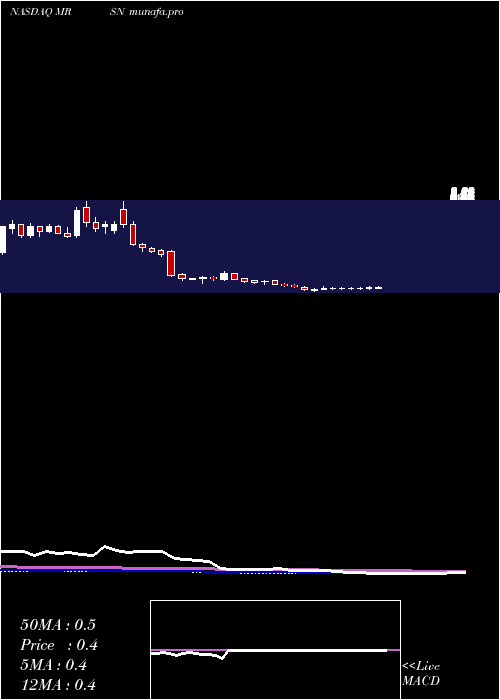
Monthly price and charts MersanaTherapeutics Strong monthly Stock price targets for MersanaTherapeutics MRSN are 28.13 and 30.21 | Monthly Target 1 | 26.47 | | Monthly Target 2 | 27.7 | | Monthly Target 3 | 28.546666666667 | | Monthly Target 4 | 29.78 | | Monthly Target 5 | 30.63 |
Monthly price and volumes Mersana Therapeutics
| Date |
Closing |
Open |
Range |
Volume |
Fri 19 December 2025 |
28.94 (5.5%) |
27.38 |
27.31 - 29.39 |
0.0296 times |
Fri 28 November 2025 |
27.43 (186.33%) |
9.15 |
7.54 - 29.89 |
0.1283 times |
Fri 31 October 2025 |
9.58 (23.45%) |
7.71 |
7.63 - 11.15 |
0.0505 times |
Tue 30 September 2025 |
7.76 (6.01%) |
7.33 |
6.63 - 8.22 |
0.0339 times |
Fri 29 August 2025 |
7.32 (6.86%) |
6.66 |
5.21 - 8.19 |
0.0696 times |
Thu 31 July 2025 |
6.85 (2183.33%) |
0.30 |
0.27 - 7.60 |
1.9096 times |
Mon 30 June 2025 |
0.30 (-11.76%) |
0.34 |
0.28 - 0.46 |
1.8803 times |
Fri 30 May 2025 |
0.34 (-20.93%) |
0.43 |
0.30 - 0.43 |
2.1242 times |
Wed 30 April 2025 |
0.43 (26.47%) |
0.34 |
0.26 - 0.44 |
1.7138 times |
Mon 31 March 2025 |
0.34 (-34.62%) |
0.53 |
0.34 - 0.55 |
2.0602 times |
Fri 28 February 2025 |
0.52 (-14.75%) |
0.59 |
0.48 - 0.82 |
3.0826 times |

DMA SMA EMA moving averages of Mersana Therapeutics MRSN
DMA (daily moving average) of Mersana Therapeutics MRSN
| DMA period | DMA value | | 5 day DMA | 28.95 | | 12 day DMA | 28.39 | | 20 day DMA | 28.03 | | 35 day DMA | 23 | | 50 day DMA | 19.09 | | 100 day DMA | 13.23 | | 150 day DMA | 9.07 | | 200 day DMA | 6.89 | EMA (exponential moving average) of Mersana Therapeutics MRSN
| EMA period | EMA current | EMA prev | EMA prev2 | | 5 day EMA | 28.87 | 28.84 | 28.71 | | 12 day EMA | 28.26 | 28.14 | 27.97 | | 20 day EMA | 26.9 | 26.68 | 26.42 | | 35 day EMA | 23.22 | 22.88 | 22.51 | | 50 day EMA | 19.21 | 18.81 | 18.39 |
SMA (simple moving average) of Mersana Therapeutics MRSN
| SMA period | SMA current | SMA prev | SMA prev2 | | 5 day SMA | 28.95 | 28.83 | 28.66 | | 12 day SMA | 28.39 | 28.3 | 28.17 | | 20 day SMA | 28.03 | 27.96 | 27.88 | | 35 day SMA | 23 | 22.44 | 21.88 | | 50 day SMA | 19.09 | 18.69 | 18.3 | | 100 day SMA | 13.23 | 13.01 | 12.79 | | 150 day SMA | 9.07 | 8.87 | 8.68 | | 200 day SMA | 6.89 | 6.75 | 6.61 |
|
|
