JewettCameron JCTCF full analysis,charts,indicators,moving averages,SMA,DMA,EMA,ADX,MACD,RSIJewett Cameron JCTCF WideScreen charts, DMA,SMA,EMA technical analysis, forecast prediction, by indicators ADX,MACD,RSI,CCI NASDAQ stock exchange
operates under Consumer Services sector & deals in RETAIL Building Materials
Daily price and charts and targets JewettCameron Strong Daily Stock price targets for JewettCameron JCTCF are 4.89 and 4.89 | Daily Target 1 | 4.89 | | Daily Target 2 | 4.89 | | Daily Target 3 | 4.89 | | Daily Target 4 | 4.89 | | Daily Target 5 | 4.89 |
Daily price and volume Jewett Cameron
| Date |
Closing |
Open |
Range |
Volume |
Tue 08 October 2024 |
4.89 (-2%) |
4.89 |
4.89 - 4.89 |
0.1307 times |
Mon 07 October 2024 |
4.99 (1.01%) |
4.94 |
4.94 - 4.99 |
0.7407 times |
Thu 03 October 2024 |
4.94 (0.82%) |
4.90 |
4.89 - 4.94 |
0.5664 times |
Wed 02 October 2024 |
4.90 (0%) |
4.90 |
4.90 - 4.94 |
0.3486 times |
Tue 01 October 2024 |
4.90 (-1.61%) |
4.99 |
4.90 - 4.99 |
0.5664 times |
Mon 30 September 2024 |
4.98 (1.22%) |
4.92 |
4.91 - 4.98 |
0.3268 times |
Fri 27 September 2024 |
4.92 (0.61%) |
4.87 |
4.86 - 4.92 |
0.7625 times |
Thu 26 September 2024 |
4.89 (0.62%) |
4.86 |
4.86 - 4.99 |
0.8279 times |
Wed 25 September 2024 |
4.86 (-1.02%) |
4.95 |
4.86 - 4.95 |
4.2048 times |
Tue 24 September 2024 |
4.91 (1.24%) |
4.95 |
4.86 - 4.97 |
1.5251 times |
Mon 23 September 2024 |
4.85 (-1.82%) |
4.90 |
4.85 - 4.97 |
3.1808 times |
Weekly price and charts JewettCameron Strong weekly Stock price targets for JewettCameron JCTCF are 4.84 and 4.94 | Weekly Target 1 | 4.82 | | Weekly Target 2 | 4.86 | | Weekly Target 3 | 4.9233333333333 | | Weekly Target 4 | 4.96 | | Weekly Target 5 | 5.02 |
Weekly price and volumes for Jewett Cameron
| Date |
Closing |
Open |
Range |
Volume |
Tue 08 October 2024 |
4.89 (-1.01%) |
4.94 |
4.89 - 4.99 |
0.2195 times |
Thu 03 October 2024 |
4.94 (0.41%) |
4.92 |
4.89 - 4.99 |
0.4554 times |
Fri 27 September 2024 |
4.92 (-0.4%) |
4.90 |
4.85 - 4.99 |
2.6446 times |
Fri 20 September 2024 |
4.94 (9.05%) |
4.56 |
4.56 - 5.00 |
2.5294 times |
Fri 13 September 2024 |
4.53 (0.44%) |
4.29 |
4.29 - 4.60 |
2.0959 times |
Fri 06 September 2024 |
4.51 (-2.17%) |
4.59 |
4.28 - 4.60 |
0.2743 times |
Fri 30 August 2024 |
4.61 (0%) |
4.55 |
4.55 - 4.63 |
0.0604 times |
Fri 30 August 2024 |
4.61 (5.98%) |
4.35 |
4.35 - 4.72 |
0.4828 times |
Fri 23 August 2024 |
4.35 (1.87%) |
4.35 |
4.12 - 4.40 |
0.5244 times |
Fri 16 August 2024 |
4.27 (4.4%) |
4.20 |
4.04 - 4.30 |
0.7133 times |
Fri 09 August 2024 |
4.09 (-0.24%) |
3.86 |
3.86 - 4.33 |
1.347 times |

Monthly price and charts JewettCameron Strong monthly Stock price targets for JewettCameron JCTCF are 4.84 and 4.94 | Monthly Target 1 | 4.82 | | Monthly Target 2 | 4.86 | | Monthly Target 3 | 4.9233333333333 | | Monthly Target 4 | 4.96 | | Monthly Target 5 | 5.02 |
Monthly price and volumes Jewett Cameron
| Date |
Closing |
Open |
Range |
Volume |
Tue 08 October 2024 |
4.89 (-1.81%) |
4.99 |
4.89 - 4.99 |
0.1141 times |
Mon 30 September 2024 |
4.98 (8.03%) |
4.59 |
4.28 - 5.00 |
1.469 times |
Fri 30 August 2024 |
4.61 (12.44%) |
4.15 |
3.86 - 4.72 |
0.9037 times |
Wed 31 July 2024 |
4.10 (-15.46%) |
4.46 |
4.01 - 5.24 |
1.6949 times |
Fri 28 June 2024 |
4.85 (-9.51%) |
5.36 |
4.70 - 5.69 |
1.041 times |
Fri 31 May 2024 |
5.36 (2.49%) |
5.24 |
5.16 - 5.50 |
1.684 times |
Tue 30 April 2024 |
5.23 (-2.06%) |
5.59 |
4.50 - 5.69 |
1.041 times |
Wed 27 March 2024 |
5.34 (1.33%) |
5.21 |
5.05 - 5.71 |
0.2822 times |
Fri 23 February 2024 |
5.27 (0.38%) |
5.30 |
5.02 - 5.88 |
0.2875 times |
Wed 31 January 2024 |
5.25 (-3.31%) |
5.45 |
5.03 - 6.35 |
1.4827 times |
Fri 29 December 2023 |
5.43 (11.73%) |
4.94 |
4.89 - 5.75 |
1.5187 times |

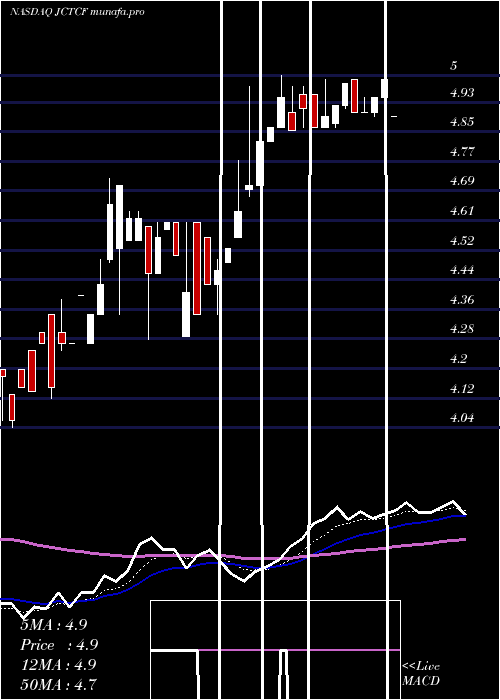
DMA SMA EMA moving averages of Jewett Cameron JCTCF
DMA (daily moving average) of Jewett Cameron JCTCF
| DMA period | DMA value | | 5 day DMA | 4.92 | | 12 day DMA | 4.91 | | 20 day DMA | 4.79 | | 35 day DMA | 4.65 | | 50 day DMA | 4.5 | | 100 day DMA | 4.8 | | 150 day DMA | 4.97 | | 200 day DMA | 5.08 | EMA (exponential moving average) of Jewett Cameron JCTCF
| EMA period | EMA current | EMA prev | EMA prev2 | | 5 day EMA | 4.92 | 4.94 | 4.92 | | 12 day EMA | 4.87 | 4.87 | 4.85 | | 20 day EMA | 4.81 | 4.8 | 4.78 | | 35 day EMA | 4.68 | 4.67 | 4.65 | | 50 day EMA | 4.55 | 4.54 | 4.52 |
SMA (simple moving average) of Jewett Cameron JCTCF
| SMA period | SMA current | SMA prev | SMA prev2 | | 5 day SMA | 4.92 | 4.94 | 4.93 | | 12 day SMA | 4.91 | 4.91 | 4.9 | | 20 day SMA | 4.79 | 4.76 | 4.74 | | 35 day SMA | 4.65 | 4.63 | 4.61 | | 50 day SMA | 4.5 | 4.49 | 4.48 | | 100 day SMA | 4.8 | 4.8 | 4.81 | | 150 day SMA | 4.97 | 4.98 | 4.98 | | 200 day SMA | 5.08 | 5.08 | 5.08 |
|
|
