IntraCellular ITCI full analysis,charts,indicators,moving averages,SMA,DMA,EMA,ADX,MACD,RSIIntra Cellular ITCI WideScreen charts, DMA,SMA,EMA technical analysis, forecast prediction, by indicators ADX,MACD,RSI,CCI NASDAQ stock exchange
operates under Health Care sector & deals in Major Pharmaceuticals
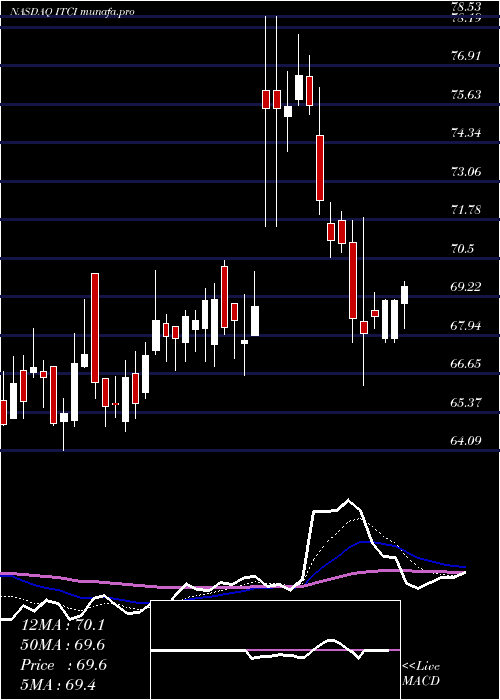
Daily price and charts and targets IntraCellular Strong Daily Stock price targets for IntraCellular ITCI are 64.01 and 68.19 | Daily Target 1 | 63.22 | | Daily Target 2 | 64.79 | | Daily Target 3 | 67.396666666667 | | Daily Target 4 | 68.97 | | Daily Target 5 | 71.58 |
Daily price and volume Intra Cellular
| Date |
Closing |
Open |
Range |
Volume |
Thu 23 May 2024 |
66.37 (-1.38%) |
70.00 |
65.82 - 70.00 |
1.1357 times |
Wed 22 May 2024 |
67.30 (0.45%) |
66.88 |
66.86 - 69.12 |
1.0097 times |
Tue 21 May 2024 |
67.00 (2.57%) |
65.10 |
64.89 - 67.99 |
1.2525 times |
Mon 20 May 2024 |
65.32 (0.49%) |
65.06 |
64.09 - 65.82 |
1.242 times |
Fri 17 May 2024 |
65.00 (-2.3%) |
66.88 |
64.92 - 66.88 |
0.9478 times |
Thu 16 May 2024 |
66.53 (-0.46%) |
66.72 |
65.51 - 67.09 |
0.8993 times |
Wed 15 May 2024 |
66.84 (1.72%) |
66.68 |
66.51 - 68.16 |
0.8597 times |
Tue 14 May 2024 |
65.71 (-0.92%) |
66.76 |
65.17 - 67.27 |
0.8663 times |
Mon 13 May 2024 |
66.32 (2.09%) |
65.16 |
65.16 - 67.22 |
0.8787 times |
Fri 10 May 2024 |
64.96 (-0.92%) |
65.75 |
64.92 - 66.71 |
0.9084 times |
Thu 09 May 2024 |
65.56 (-2.15%) |
66.97 |
65.45 - 67.23 |
0.9536 times |
Weekly price and charts IntraCellular Strong weekly Stock price targets for IntraCellular ITCI are 65.23 and 71.14 | Weekly Target 1 | 60.91 | | Weekly Target 2 | 63.64 | | Weekly Target 3 | 66.82 | | Weekly Target 4 | 69.55 | | Weekly Target 5 | 72.73 |
Weekly price and volumes for Intra Cellular
| Date |
Closing |
Open |
Range |
Volume |
Thu 23 May 2024 |
66.37 (2.11%) |
65.06 |
64.09 - 70.00 |
0.7576 times |
Fri 17 May 2024 |
65.00 (0.06%) |
65.16 |
64.92 - 68.16 |
0.7269 times |
Fri 10 May 2024 |
64.96 (-5.58%) |
68.88 |
64.92 - 71.64 |
0.8871 times |
Fri 03 May 2024 |
68.80 (-6.09%) |
73.58 |
68.48 - 73.82 |
0.8628 times |
Fri 26 April 2024 |
73.26 (1.23%) |
73.68 |
71.35 - 76.89 |
0.9631 times |
Fri 19 April 2024 |
72.37 (9.85%) |
65.71 |
64.16 - 84.89 |
3.5821 times |
Fri 12 April 2024 |
65.88 (-3.74%) |
68.74 |
64.84 - 69.02 |
0.4932 times |
Fri 05 April 2024 |
68.44 (-1.1%) |
69.20 |
65.93 - 69.50 |
0.5725 times |
Thu 28 March 2024 |
69.20 (0.26%) |
69.59 |
67.13 - 70.07 |
0.4567 times |
Fri 22 March 2024 |
69.02 (6.55%) |
64.97 |
63.87 - 69.90 |
0.6981 times |
Fri 15 March 2024 |
64.78 (-4%) |
67.32 |
63.30 - 67.59 |
0.7425 times |
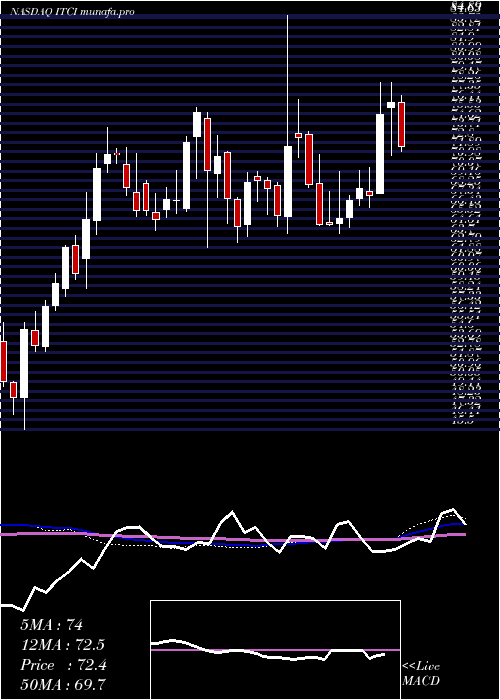
Monthly price and charts IntraCellular Strong monthly Stock price targets for IntraCellular ITCI are 60.39 and 70.07 | Monthly Target 1 | 58.4 | | Monthly Target 2 | 62.38 | | Monthly Target 3 | 68.076666666667 | | Monthly Target 4 | 72.06 | | Monthly Target 5 | 77.76 |
Monthly price and volumes Intra Cellular
| Date |
Closing |
Open |
Range |
Volume |
Thu 23 May 2024 |
66.37 (-7.58%) |
71.61 |
64.09 - 73.77 |
0.8061 times |
Tue 30 April 2024 |
71.81 (3.77%) |
69.20 |
64.16 - 84.89 |
1.6096 times |
Thu 28 March 2024 |
69.20 (-0.46%) |
69.93 |
63.30 - 72.31 |
0.7474 times |
Thu 29 February 2024 |
69.52 (3.24%) |
67.76 |
62.78 - 76.11 |
0.951 times |
Wed 31 January 2024 |
67.34 (-5.98%) |
70.69 |
64.38 - 72.33 |
1.0289 times |
Fri 29 December 2023 |
71.62 (16.7%) |
61.37 |
58.93 - 74.17 |
1.0815 times |
Thu 30 November 2023 |
61.37 (23.33%) |
49.90 |
49.30 - 61.41 |
1.0144 times |
Tue 31 October 2023 |
49.76 (-4.47%) |
51.83 |
45.50 - 55.69 |
1.2053 times |
Fri 29 September 2023 |
52.09 (-6.18%) |
55.59 |
51.93 - 59.90 |
0.7308 times |
Thu 31 August 2023 |
55.52 (-10.22%) |
61.97 |
54.45 - 62.07 |
0.8249 times |
Mon 31 July 2023 |
61.84 (-2.34%) |
62.91 |
58.61 - 65.00 |
0.6998 times |
DMA SMA EMA moving averages of Intra Cellular ITCI
DMA (daily moving average) of Intra Cellular ITCI
| DMA period | DMA value | | 5 day DMA | 66.2 | | 12 day DMA | 66.16 | | 20 day DMA | 68.27 | | 35 day DMA | 69.45 | | 50 day DMA | 68.78 | | 100 day DMA | 68.89 | | 150 day DMA | 65.81 | | 200 day DMA | 63.01 | EMA (exponential moving average) of Intra Cellular ITCI
| EMA period | EMA current | EMA prev | EMA prev2 | | 5 day EMA | 66.5 | 66.57 | 66.21 | | 12 day EMA | 66.97 | 67.08 | 67.04 | | 20 day EMA | 67.67 | 67.81 | 67.86 | | 35 day EMA | 67.93 | 68.02 | 68.06 | | 50 day EMA | 68.29 | 68.37 | 68.41 |
SMA (simple moving average) of Intra Cellular ITCI
| SMA period | SMA current | SMA prev | SMA prev2 | | 5 day SMA | 66.2 | 66.23 | 66.14 | | 12 day SMA | 66.16 | 66.56 | 66.87 | | 20 day SMA | 68.27 | 68.56 | 68.85 | | 35 day SMA | 69.45 | 69.47 | 69.47 | | 50 day SMA | 68.78 | 68.76 | 68.7 | | 100 day SMA | 68.89 | 68.93 | 68.97 | | 150 day SMA | 65.81 | 65.7 | 65.58 | | 200 day SMA | 63.01 | 62.96 | 62.92 |
|
|
