IsramcoInc ISRL full analysis,charts,indicators,moving averages,SMA,DMA,EMA,ADX,MACD,RSIIsramco Inc ISRL WideScreen charts, DMA,SMA,EMA technical analysis, forecast prediction, by indicators ADX,MACD,RSI,CCI NASDAQ stock exchange
operates under Energy sector & deals in Oil Gas Production
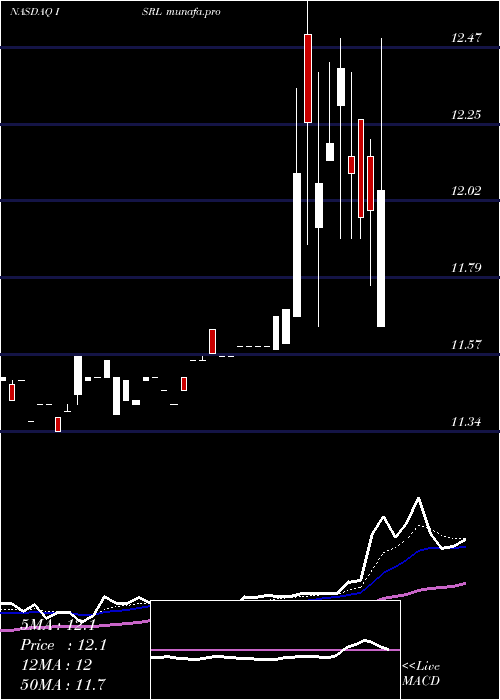
Daily price and charts and targets IsramcoInc Strong Daily Stock price targets for IsramcoInc ISRL are 12.42 and 12.55 | Daily Target 1 | 12.31 | | Daily Target 2 | 12.39 | | Daily Target 3 | 12.436666666667 | | Daily Target 4 | 12.52 | | Daily Target 5 | 12.57 |
Daily price and volume Isramco Inc
| Date |
Closing |
Open |
Range |
Volume |
Thu 30 October 2025 |
12.48 (-0.08%) |
12.35 |
12.35 - 12.48 |
0.084 times |
Wed 29 October 2025 |
12.49 (0.48%) |
12.35 |
12.35 - 12.49 |
0.084 times |
Tue 28 October 2025 |
12.43 (-0.4%) |
12.42 |
12.35 - 12.49 |
0.6303 times |
Mon 27 October 2025 |
12.48 (0.08%) |
12.42 |
12.42 - 12.48 |
0.1681 times |
Tue 21 October 2025 |
12.47 (-0.16%) |
12.33 |
12.33 - 12.49 |
0.1681 times |
Mon 20 October 2025 |
12.49 (0.73%) |
12.35 |
12.35 - 12.49 |
0.2941 times |
Fri 17 October 2025 |
12.40 (0%) |
12.40 |
12.40 - 12.40 |
0.084 times |
Thu 16 October 2025 |
12.40 (0.4%) |
12.35 |
12.35 - 12.40 |
1.3445 times |
Wed 15 October 2025 |
12.35 (0%) |
12.35 |
12.28 - 12.37 |
7.0168 times |
Tue 14 October 2025 |
12.35 (0.57%) |
12.35 |
12.35 - 12.35 |
0.1261 times |
Mon 13 October 2025 |
12.28 (0.16%) |
12.35 |
12.28 - 12.35 |
0.5462 times |
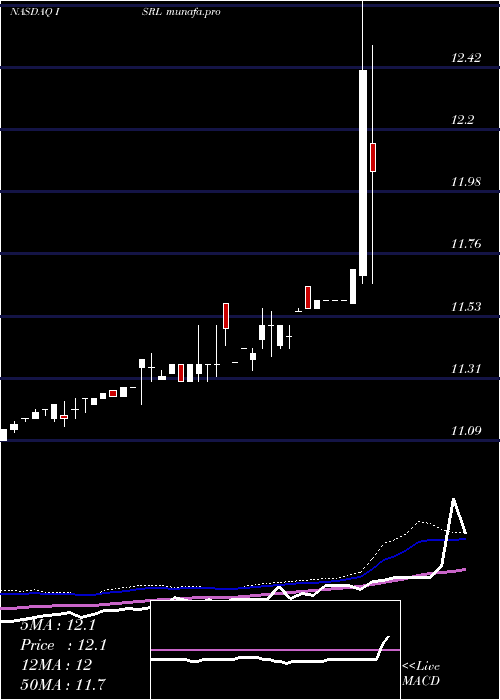
Weekly price and charts IsramcoInc Strong weekly Stock price targets for IsramcoInc ISRL are 12.42 and 12.56 | Weekly Target 1 | 12.3 | | Weekly Target 2 | 12.39 | | Weekly Target 3 | 12.44 | | Weekly Target 4 | 12.53 | | Weekly Target 5 | 12.58 |
Weekly price and volumes for Isramco Inc
| Date |
Closing |
Open |
Range |
Volume |
Thu 30 October 2025 |
12.48 (0.08%) |
12.42 |
12.35 - 12.49 |
0.1134 times |
Tue 21 October 2025 |
12.47 (0.56%) |
12.35 |
12.33 - 12.49 |
0.0542 times |
Fri 17 October 2025 |
12.40 (1.14%) |
12.35 |
12.28 - 12.40 |
1.0701 times |
Fri 10 October 2025 |
12.26 (-3.46%) |
12.56 |
11.81 - 13.00 |
5.0548 times |
Fri 03 October 2025 |
12.70 (-2.31%) |
12.25 |
12.16 - 12.70 |
1.7053 times |
Thu 25 September 2025 |
13.00 (2.77%) |
12.22 |
12.22 - 13.00 |
0.1627 times |
Fri 19 September 2025 |
12.65 (0%) |
12.28 |
12.11 - 12.65 |
0.1627 times |
Tue 09 September 2025 |
12.65 (1.2%) |
12.56 |
12.56 - 12.65 |
0.0641 times |
Fri 05 September 2025 |
12.50 (-0.71%) |
12.47 |
11.99 - 12.70 |
1.5879 times |
Fri 29 August 2025 |
12.59 (0%) |
12.50 |
12.50 - 12.59 |
0.0247 times |
Fri 29 August 2025 |
12.59 (-1.64%) |
12.66 |
12.40 - 12.66 |
0.0838 times |
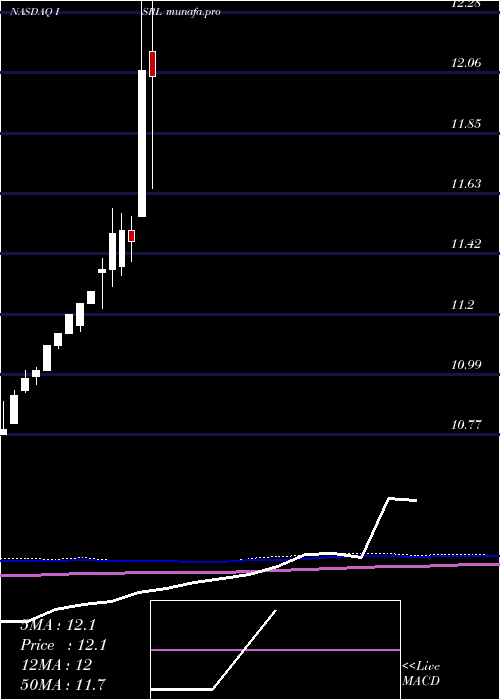
Monthly price and charts IsramcoInc Strong monthly Stock price targets for IsramcoInc ISRL are 12.15 and 13.34 | Monthly Target 1 | 11.24 | | Monthly Target 2 | 11.86 | | Monthly Target 3 | 12.43 | | Monthly Target 4 | 13.05 | | Monthly Target 5 | 13.62 |
Monthly price and volumes Isramco Inc
| Date |
Closing |
Open |
Range |
Volume |
Thu 30 October 2025 |
12.48 (-0.79%) |
12.45 |
11.81 - 13.00 |
0.8774 times |
Tue 30 September 2025 |
12.58 (-0.08%) |
12.47 |
11.99 - 13.00 |
0.4838 times |
Fri 29 August 2025 |
12.59 (1.53%) |
12.04 |
11.81 - 13.00 |
0.3412 times |
Thu 31 July 2025 |
12.40 (-2.36%) |
12.54 |
12.03 - 12.98 |
0.5789 times |
Mon 30 June 2025 |
12.70 (-0.24%) |
12.73 |
12.31 - 13.90 |
2.2678 times |
Fri 30 May 2025 |
12.73 (5.47%) |
12.14 |
11.65 - 14.00 |
2.1487 times |
Wed 30 April 2025 |
12.07 (5.32%) |
11.55 |
11.55 - 12.89 |
2.652 times |
Wed 19 March 2025 |
11.46 (-0.35%) |
11.50 |
11.39 - 11.55 |
0.2518 times |
Fri 28 February 2025 |
11.50 (0.09%) |
11.37 |
11.34 - 11.56 |
0.1938 times |
Thu 30 January 2025 |
11.49 (1.14%) |
11.36 |
11.30 - 11.58 |
0.2044 times |
Mon 30 December 2024 |
11.36 (0.71%) |
11.35 |
11.22 - 11.40 |
5.1943 times |
DMA SMA EMA moving averages of Isramco Inc ISRL
DMA (daily moving average) of Isramco Inc ISRL
| DMA period | DMA value | | 5 day DMA | 12.47 | | 12 day DMA | 12.41 | | 20 day DMA | 12.45 | | 35 day DMA | 12.52 | | 50 day DMA | 12.53 | | 100 day DMA | 12.55 | | 150 day DMA | 12.2 | | 200 day DMA | 11.96 | EMA (exponential moving average) of Isramco Inc ISRL
| EMA period | EMA current | EMA prev | EMA prev2 | | 5 day EMA | 12.47 | 12.46 | 12.44 | | 12 day EMA | 12.46 | 12.46 | 12.45 | | 20 day EMA | 12.46 | 12.46 | 12.46 | | 35 day EMA | 12.48 | 12.48 | 12.48 | | 50 day EMA | 12.53 | 12.53 | 12.53 |
SMA (simple moving average) of Isramco Inc ISRL
| SMA period | SMA current | SMA prev | SMA prev2 | | 5 day SMA | 12.47 | 12.47 | 12.45 | | 12 day SMA | 12.41 | 12.39 | 12.38 | | 20 day SMA | 12.45 | 12.48 | 12.49 | | 35 day SMA | 12.52 | 12.52 | 12.52 | | 50 day SMA | 12.53 | 12.53 | 12.53 | | 100 day SMA | 12.55 | 12.54 | 12.54 | | 150 day SMA | 12.2 | 12.2 | 12.19 | | 200 day SMA | 11.96 | 11.96 | 11.95 |
|
|
