IMab IMAB full analysis,charts,indicators,moving averages,SMA,DMA,EMA,ADX,MACD,RSII Mab IMAB WideScreen charts, DMA,SMA,EMA technical analysis, forecast prediction, by indicators ADX,MACD,RSI,CCI NASDAQ stock exchange
Daily price and charts and targets IMab Strong Daily Stock price targets for IMab IMAB are 3.82 and 4.29 | Daily Target 1 | 3.71 | | Daily Target 2 | 3.93 | | Daily Target 3 | 4.1766666666667 | | Daily Target 4 | 4.4 | | Daily Target 5 | 4.65 |
Daily price and volume I Mab
| Date |
Closing |
Open |
Range |
Volume |
Fri 29 August 2025 |
4.16 (-2.12%) |
4.31 |
3.95 - 4.42 |
0.7364 times |
Thu 28 August 2025 |
4.25 (-5.56%) |
4.46 |
4.22 - 4.84 |
0.8529 times |
Wed 27 August 2025 |
4.50 (-13.13%) |
4.97 |
4.36 - 4.97 |
1.2475 times |
Tue 26 August 2025 |
5.18 (7.47%) |
4.95 |
4.86 - 5.25 |
0.4484 times |
Mon 25 August 2025 |
4.82 (-5.3%) |
5.20 |
4.75 - 5.41 |
1.1012 times |
Fri 22 August 2025 |
5.09 (8.07%) |
4.75 |
4.74 - 5.64 |
1.8275 times |
Thu 21 August 2025 |
4.71 (4.2%) |
4.38 |
4.34 - 4.90 |
0.6402 times |
Wed 20 August 2025 |
4.52 (7.36%) |
4.15 |
4.13 - 4.69 |
0.7864 times |
Tue 19 August 2025 |
4.21 (-17.29%) |
5.08 |
4.21 - 5.14 |
1.4524 times |
Mon 18 August 2025 |
5.09 (4.52%) |
4.95 |
4.73 - 5.28 |
0.9072 times |
Fri 15 August 2025 |
4.87 (-5.62%) |
5.22 |
4.71 - 5.90 |
2.5816 times |
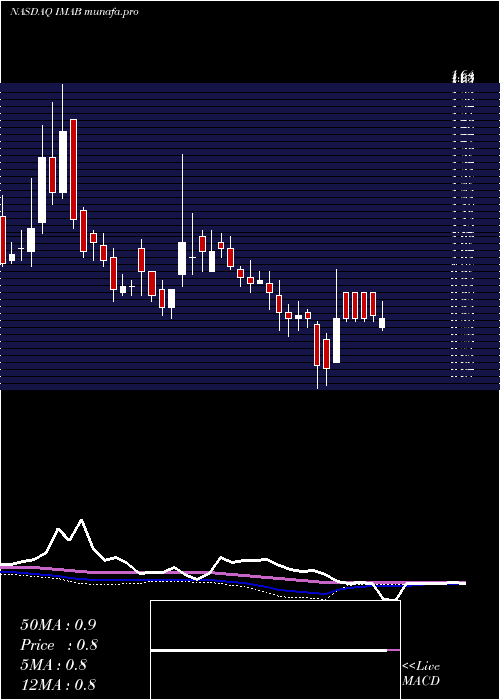
Weekly price and charts IMab Strong weekly Stock price targets for IMab IMAB are 3.33 and 4.79 | Weekly Target 1 | 3.05 | | Weekly Target 2 | 3.6 | | Weekly Target 3 | 4.5066666666667 | | Weekly Target 4 | 5.06 | | Weekly Target 5 | 5.97 |
Weekly price and volumes for I Mab
| Date |
Closing |
Open |
Range |
Volume |
Fri 29 August 2025 |
4.16 (-18.27%) |
5.20 |
3.95 - 5.41 |
0.7709 times |
Fri 22 August 2025 |
5.09 (4.52%) |
4.95 |
4.13 - 5.64 |
0.9866 times |
Fri 15 August 2025 |
4.87 (42.82%) |
3.49 |
3.45 - 5.90 |
1.5291 times |
Fri 08 August 2025 |
3.41 (30.15%) |
3.05 |
2.93 - 4.18 |
1.244 times |
Fri 01 August 2025 |
2.62 (24.17%) |
2.14 |
1.65 - 3.44 |
4.4072 times |
Fri 25 July 2025 |
2.11 (0.48%) |
2.11 |
2.01 - 2.16 |
0.0779 times |
Fri 18 July 2025 |
2.10 (-1.41%) |
2.08 |
2.06 - 2.25 |
0.0664 times |
Fri 11 July 2025 |
2.13 (-0.93%) |
2.07 |
2.02 - 2.41 |
0.1654 times |
Thu 03 July 2025 |
2.15 (-16.34%) |
2.74 |
2.10 - 2.74 |
0.1746 times |
Fri 27 June 2025 |
2.57 (2.8%) |
2.53 |
2.00 - 2.95 |
0.578 times |
Fri 20 June 2025 |
2.50 (0.4%) |
2.48 |
2.29 - 2.69 |
0.1003 times |
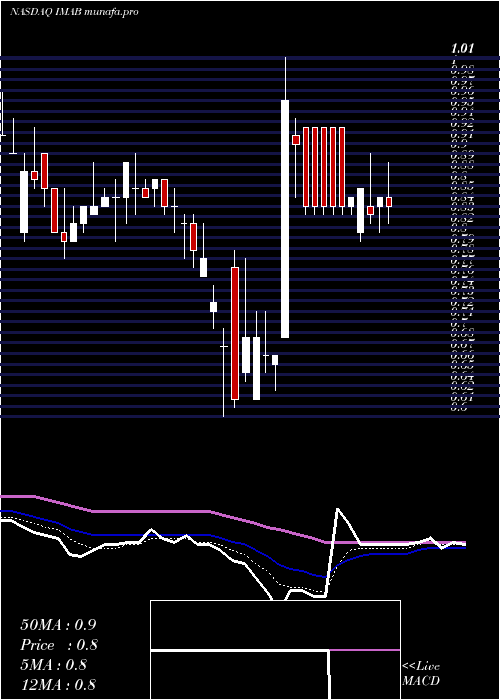
Monthly price and charts IMab Strong monthly Stock price targets for IMab IMAB are 3.21 and 6.86 | Monthly Target 1 | 0.45 | | Monthly Target 2 | 2.31 | | Monthly Target 3 | 4.1033333333333 | | Monthly Target 4 | 5.96 | | Monthly Target 5 | 7.75 |
Monthly price and volumes I Mab
| Date |
Closing |
Open |
Range |
Volume |
Fri 29 August 2025 |
4.16 (106.97%) |
2.26 |
2.25 - 5.90 |
5.5289 times |
Thu 31 July 2025 |
2.01 (-16.94%) |
2.43 |
1.65 - 2.50 |
0.4658 times |
Mon 30 June 2025 |
2.42 (84.73%) |
1.34 |
1.20 - 3.08 |
1.3726 times |
Fri 30 May 2025 |
1.31 (39.36%) |
0.88 |
0.83 - 1.47 |
0.2834 times |
Wed 30 April 2025 |
0.94 (14.63%) |
0.82 |
0.60 - 1.01 |
0.2972 times |
Mon 31 March 2025 |
0.82 (-11.83%) |
0.92 |
0.78 - 0.97 |
0.2679 times |
Fri 28 February 2025 |
0.93 (-8.82%) |
1.01 |
0.87 - 1.04 |
0.2482 times |
Fri 31 January 2025 |
1.02 (20%) |
0.85 |
0.85 - 1.40 |
0.7096 times |
Tue 31 December 2024 |
0.85 (-10.53%) |
1.08 |
0.84 - 1.11 |
0.4935 times |
Tue 26 November 2024 |
0.95 (-11.21%) |
1.09 |
0.90 - 1.14 |
0.333 times |
Thu 31 October 2024 |
1.07 (-13.71%) |
1.23 |
1.05 - 1.64 |
0.7275 times |

DMA SMA EMA moving averages of I Mab IMAB
DMA (daily moving average) of I Mab IMAB
| DMA period | DMA value | | 5 day DMA | 4.58 | | 12 day DMA | 4.71 | | 20 day DMA | 4.26 | | 35 day DMA | 3.32 | | 50 day DMA | 3.02 | | 100 day DMA | 2.11 | | 150 day DMA | 1.71 | | 200 day DMA | 1.53 | EMA (exponential moving average) of I Mab IMAB
| EMA period | EMA current | EMA prev | EMA prev2 | | 5 day EMA | 4.45 | 4.6 | 4.77 | | 12 day EMA | 4.44 | 4.49 | 4.53 | | 20 day EMA | 4.14 | 4.14 | 4.13 | | 35 day EMA | 3.71 | 3.68 | 3.65 | | 50 day EMA | 3.14 | 3.1 | 3.05 |
SMA (simple moving average) of I Mab IMAB
| SMA period | SMA current | SMA prev | SMA prev2 | | 5 day SMA | 4.58 | 4.77 | 4.86 | | 12 day SMA | 4.71 | 4.72 | 4.69 | | 20 day SMA | 4.26 | 4.15 | 4.04 | | 35 day SMA | 3.32 | 3.26 | 3.2 | | 50 day SMA | 3.02 | 2.99 | 2.95 | | 100 day SMA | 2.11 | 2.08 | 2.04 | | 150 day SMA | 1.71 | 1.69 | 1.67 | | 200 day SMA | 1.53 | 1.52 | 1.5 |
|
|
