GoldenOcean GOGL full analysis,charts,indicators,moving averages,SMA,DMA,EMA,ADX,MACD,RSIGolden Ocean GOGL WideScreen charts, DMA,SMA,EMA technical analysis, forecast prediction, by indicators ADX,MACD,RSI,CCI NASDAQ stock exchange
operates under Consumer Services sector & deals in Marine Transportation
Daily price and charts and targets GoldenOcean Strong Daily Stock price targets for GoldenOcean GOGL are 8.32 and 8.52 | Daily Target 1 | 8.15 | | Daily Target 2 | 8.28 | | Daily Target 3 | 8.35 | | Daily Target 4 | 8.48 | | Daily Target 5 | 8.55 |
Daily price and volume Golden Ocean
| Date |
Closing |
Open |
Range |
Volume |
Fri 11 July 2025 |
8.41 (2.94%) |
8.32 |
8.22 - 8.42 |
0.7267 times |
Thu 10 July 2025 |
8.17 (5.15%) |
7.82 |
7.82 - 8.27 |
1.5968 times |
Wed 09 July 2025 |
7.77 (-2.63%) |
7.95 |
7.76 - 7.96 |
1.1222 times |
Tue 08 July 2025 |
7.98 (0.5%) |
8.00 |
7.91 - 8.05 |
1.1097 times |
Mon 07 July 2025 |
7.94 (0%) |
7.93 |
7.88 - 8.08 |
0.6687 times |
Thu 03 July 2025 |
7.94 (1.4%) |
7.90 |
7.83 - 8.01 |
1.2606 times |
Wed 02 July 2025 |
7.83 (5.38%) |
7.61 |
7.60 - 7.86 |
1.191 times |
Tue 01 July 2025 |
7.43 (1.5%) |
7.35 |
7.28 - 7.54 |
0.4903 times |
Mon 30 June 2025 |
7.32 (-2.14%) |
7.45 |
7.26 - 7.45 |
0.6441 times |
Fri 27 June 2025 |
7.48 (-0.53%) |
7.54 |
7.42 - 7.61 |
1.1899 times |
Thu 26 June 2025 |
7.52 (-1.18%) |
7.60 |
7.50 - 7.64 |
0.4191 times |
Weekly price and charts GoldenOcean Strong weekly Stock price targets for GoldenOcean GOGL are 8.09 and 8.75 | Weekly Target 1 | 7.54 | | Weekly Target 2 | 7.97 | | Weekly Target 3 | 8.1966666666667 | | Weekly Target 4 | 8.63 | | Weekly Target 5 | 8.86 |
Weekly price and volumes for Golden Ocean
| Date |
Closing |
Open |
Range |
Volume |
Fri 11 July 2025 |
8.41 (5.92%) |
7.93 |
7.76 - 8.42 |
1.6005 times |
Thu 03 July 2025 |
7.94 (6.15%) |
7.45 |
7.26 - 8.01 |
1.0986 times |
Fri 27 June 2025 |
7.48 (-1.97%) |
7.66 |
7.42 - 7.74 |
0.9643 times |
Fri 20 June 2025 |
7.63 (-4.15%) |
7.93 |
7.61 - 7.95 |
0.4623 times |
Fri 13 June 2025 |
7.96 (3.38%) |
7.71 |
7.63 - 7.98 |
0.7654 times |
Fri 06 June 2025 |
7.70 (0%) |
7.68 |
7.47 - 7.84 |
0.9021 times |
Fri 30 May 2025 |
7.70 (6.5%) |
7.29 |
7.11 - 7.77 |
1.2524 times |
Fri 23 May 2025 |
7.23 (-10.3%) |
7.98 |
7.05 - 8.05 |
1.1802 times |
Fri 16 May 2025 |
8.06 (7.75%) |
7.89 |
7.79 - 8.13 |
0.9117 times |
Fri 09 May 2025 |
7.48 (-4.35%) |
7.90 |
7.48 - 7.98 |
0.8626 times |
Fri 02 May 2025 |
7.82 (0.64%) |
7.60 |
7.49 - 7.95 |
1.0283 times |

Monthly price and charts GoldenOcean Strong monthly Stock price targets for GoldenOcean GOGL are 7.85 and 8.99 | Monthly Target 1 | 6.9 | | Monthly Target 2 | 7.65 | | Monthly Target 3 | 8.0366666666667 | | Monthly Target 4 | 8.79 | | Monthly Target 5 | 9.18 |
Monthly price and volumes Golden Ocean
| Date |
Closing |
Open |
Range |
Volume |
Fri 11 July 2025 |
8.41 (14.89%) |
7.35 |
7.28 - 8.42 |
0.5617 times |
Mon 30 June 2025 |
7.32 (-4.94%) |
7.68 |
7.26 - 7.98 |
0.739 times |
Fri 30 May 2025 |
7.70 (-0.26%) |
7.77 |
7.05 - 8.13 |
1.0182 times |
Wed 30 April 2025 |
7.72 (-3.26%) |
8.08 |
6.27 - 8.40 |
1.8196 times |
Mon 31 March 2025 |
7.98 (-17.73%) |
9.77 |
7.49 - 10.17 |
2.2819 times |
Fri 28 February 2025 |
9.70 (4.86%) |
8.98 |
8.89 - 10.04 |
1.1058 times |
Fri 31 January 2025 |
9.25 (3.24%) |
9.24 |
8.72 - 9.52 |
0.7858 times |
Tue 31 December 2024 |
8.96 (-17.5%) |
9.43 |
8.52 - 9.58 |
0.4695 times |
Tue 26 November 2024 |
10.86 (1.31%) |
10.74 |
10.71 - 12.28 |
0.5963 times |
Thu 31 October 2024 |
10.72 (-19.88%) |
12.95 |
10.61 - 13.27 |
0.6222 times |
Mon 30 September 2024 |
13.38 (8.78%) |
11.91 |
10.86 - 13.44 |
0.6407 times |

DMA SMA EMA moving averages of Golden Ocean GOGL
DMA (daily moving average) of Golden Ocean GOGL
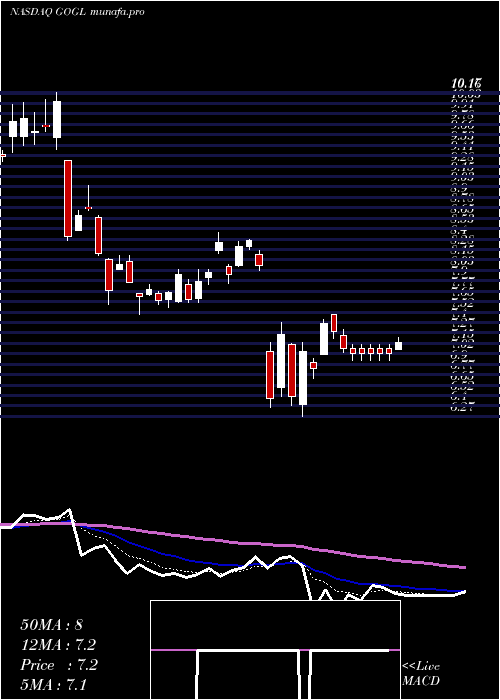
| DMA period | DMA value | | 5 day DMA | 8.05 | | 12 day DMA | 7.78 | | 20 day DMA | 7.78 | | 35 day DMA | 7.68 | | 50 day DMA | 7.72 | | 100 day DMA | 7.89 | | 150 day DMA | 8.31 | | 200 day DMA | 9.19 | EMA (exponential moving average) of Golden Ocean GOGL
| EMA period | EMA current | EMA prev | EMA prev2 | | 5 day EMA | 8.1 | 7.94 | 7.82 | | 12 day EMA | 7.9 | 7.81 | 7.74 | | 20 day EMA | 7.81 | 7.75 | 7.71 | | 35 day EMA | 7.78 | 7.74 | 7.71 | | 50 day EMA | 7.73 | 7.7 | 7.68 |
SMA (simple moving average) of Golden Ocean GOGL
| SMA period | SMA current | SMA prev | SMA prev2 | | 5 day SMA | 8.05 | 7.96 | 7.89 | | 12 day SMA | 7.78 | 7.71 | 7.66 | | 20 day SMA | 7.78 | 7.74 | 7.72 | | 35 day SMA | 7.68 | 7.67 | 7.67 | | 50 day SMA | 7.72 | 7.7 | 7.7 | | 100 day SMA | 7.89 | 7.9 | 7.91 | | 150 day SMA | 8.31 | 8.33 | 8.35 | | 200 day SMA | 9.19 | 9.21 | 9.23 |
|
|
