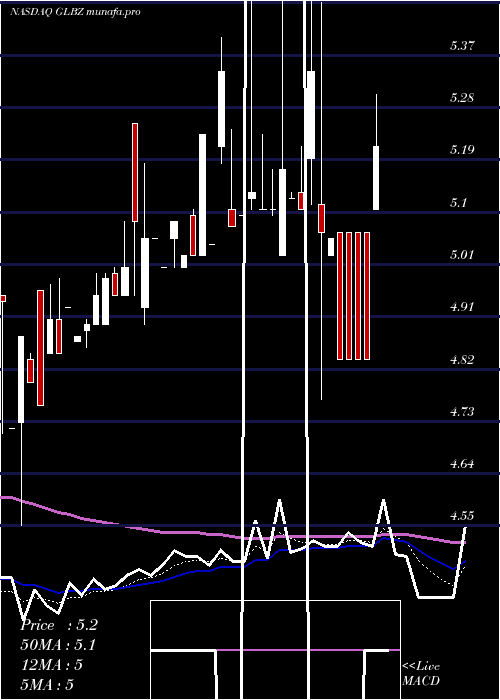
GlenBurnie GLBZ full analysis,charts,indicators,moving averages,SMA,DMA,EMA,ADX,MACD,RSIGlen Burnie GLBZ WideScreen charts, DMA,SMA,EMA technical analysis, forecast prediction, by indicators ADX,MACD,RSI,CCI NASDAQ stock exchange
operates under Finance sector & deals in Major Banks
Daily price and charts and targets GlenBurnie Strong Daily Stock price targets for GlenBurnie GLBZ are 4.24 and 4.59 | Daily Target 1 | 3.97 | | Daily Target 2 | 4.15 | | Daily Target 3 | 4.3233333333333 | | Daily Target 4 | 4.5 | | Daily Target 5 | 4.67 |
Daily price and volume Glen Burnie
| Date |
Closing |
Open |
Range |
Volume |
Thu 18 December 2025 |
4.32 (-2.26%) |
4.18 |
4.15 - 4.50 |
1.7553 times |
Wed 17 December 2025 |
4.42 (0%) |
4.39 |
4.39 - 4.50 |
0.3646 times |
Tue 16 December 2025 |
4.42 (2.55%) |
4.39 |
4.39 - 4.49 |
0.4079 times |
Mon 15 December 2025 |
4.31 (5.12%) |
4.44 |
4.31 - 4.50 |
1.8109 times |
Fri 12 December 2025 |
4.10 (-5.75%) |
3.83 |
3.76 - 4.28 |
3.0532 times |
Thu 11 December 2025 |
4.35 (0%) |
4.44 |
4.34 - 4.44 |
0.4141 times |
Wed 10 December 2025 |
4.35 (0.46%) |
4.35 |
4.35 - 4.40 |
0.8344 times |
Tue 09 December 2025 |
4.33 (2.36%) |
4.29 |
4.23 - 4.35 |
0.8591 times |
Mon 08 December 2025 |
4.23 (-0.94%) |
4.24 |
4.22 - 4.29 |
0.4574 times |
Fri 05 December 2025 |
4.27 (1.43%) |
4.27 |
4.27 - 4.27 |
0.0433 times |
Thu 04 December 2025 |
4.21 (1.94%) |
4.13 |
4.13 - 4.28 |
0.309 times |
Weekly price and charts GlenBurnie Strong weekly Stock price targets for GlenBurnie GLBZ are 4.06 and 4.41 | Weekly Target 1 | 3.97 | | Weekly Target 2 | 4.15 | | Weekly Target 3 | 4.3233333333333 | | Weekly Target 4 | 4.5 | | Weekly Target 5 | 4.67 |
Weekly price and volumes for Glen Burnie
| Date |
Closing |
Open |
Range |
Volume |
Thu 18 December 2025 |
4.32 (5.37%) |
4.44 |
4.15 - 4.50 |
1.6879 times |
Fri 12 December 2025 |
4.10 (-3.98%) |
4.24 |
3.76 - 4.44 |
2.1856 times |
Fri 05 December 2025 |
4.27 (-2.51%) |
4.19 |
4.12 - 4.38 |
1.7192 times |
Fri 28 November 2025 |
4.38 (-2.45%) |
4.45 |
4.25 - 4.50 |
0.4088 times |
Fri 21 November 2025 |
4.49 (0.45%) |
4.48 |
4.45 - 4.50 |
0.2068 times |
Fri 14 November 2025 |
4.47 (-1.76%) |
4.55 |
4.39 - 4.79 |
1.1854 times |
Fri 07 November 2025 |
4.55 (-2.57%) |
4.69 |
4.51 - 4.69 |
0.3871 times |
Fri 31 October 2025 |
4.67 (0%) |
4.36 |
4.36 - 4.85 |
0.1659 times |
Fri 31 October 2025 |
4.67 (-3.11%) |
4.53 |
4.36 - 4.85 |
1.1974 times |
Fri 24 October 2025 |
4.82 (1.47%) |
4.78 |
4.71 - 4.89 |
0.856 times |
Fri 17 October 2025 |
4.75 (1.06%) |
4.71 |
4.30 - 4.84 |
0.4544 times |

Monthly price and charts GlenBurnie Strong monthly Stock price targets for GlenBurnie GLBZ are 4.04 and 4.78 | Monthly Target 1 | 3.45 | | Monthly Target 2 | 3.89 | | Monthly Target 3 | 4.1933333333333 | | Monthly Target 4 | 4.63 | | Monthly Target 5 | 4.93 |
Monthly price and volumes Glen Burnie
| Date |
Closing |
Open |
Range |
Volume |
Thu 18 December 2025 |
4.32 (-1.37%) |
4.19 |
3.76 - 4.50 |
1.5605 times |
Fri 28 November 2025 |
4.38 (-6.21%) |
4.69 |
4.25 - 4.79 |
0.6105 times |
Fri 31 October 2025 |
4.67 (0.43%) |
4.60 |
4.30 - 4.89 |
1.0766 times |
Tue 30 September 2025 |
4.65 (12.32%) |
4.20 |
4.12 - 4.74 |
0.534 times |
Fri 29 August 2025 |
4.14 (0.49%) |
4.38 |
3.89 - 4.60 |
1.1908 times |
Thu 31 July 2025 |
4.12 (-17.76%) |
5.14 |
4.05 - 5.88 |
1.5484 times |
Mon 30 June 2025 |
5.01 (1.21%) |
5.00 |
4.02 - 5.25 |
1.4444 times |
Fri 30 May 2025 |
4.95 (-5.71%) |
5.45 |
4.06 - 5.45 |
0.5018 times |
Wed 30 April 2025 |
5.25 (3.55%) |
5.09 |
4.70 - 5.69 |
0.8828 times |
Mon 31 March 2025 |
5.07 (3.47%) |
4.90 |
4.90 - 5.40 |
0.65 times |
Fri 28 February 2025 |
4.90 (-1.41%) |
4.90 |
4.55 - 5.18 |
0.4428 times |

DMA SMA EMA moving averages of Glen Burnie GLBZ
DMA (daily moving average) of Glen Burnie GLBZ
| DMA period | DMA value | | 5 day DMA | 4.31 | | 12 day DMA | 4.29 | | 20 day DMA | 4.33 | | 35 day DMA | 4.43 | | 50 day DMA | 4.51 | | 100 day DMA | 4.43 | | 150 day DMA | 4.64 | | 200 day DMA | 4.74 | EMA (exponential moving average) of Glen Burnie GLBZ
| EMA period | EMA current | EMA prev | EMA prev2 | | 5 day EMA | 4.34 | 4.35 | 4.32 | | 12 day EMA | 4.33 | 4.33 | 4.31 | | 20 day EMA | 4.37 | 4.37 | 4.36 | | 35 day EMA | 4.4 | 4.41 | 4.41 | | 50 day EMA | 4.51 | 4.52 | 4.52 |
SMA (simple moving average) of Glen Burnie GLBZ
| SMA period | SMA current | SMA prev | SMA prev2 | | 5 day SMA | 4.31 | 4.32 | 4.31 | | 12 day SMA | 4.29 | 4.27 | 4.26 | | 20 day SMA | 4.33 | 4.33 | 4.34 | | 35 day SMA | 4.43 | 4.44 | 4.44 | | 50 day SMA | 4.51 | 4.52 | 4.52 | | 100 day SMA | 4.43 | 4.43 | 4.44 | | 150 day SMA | 4.64 | 4.65 | 4.65 | | 200 day SMA | 4.74 | 4.74 | 4.75 |
|
|
