GuardionHealth GHSI full analysis,charts,indicators,moving averages,SMA,DMA,EMA,ADX,MACD,RSIGuardion Health GHSI WideScreen charts, DMA,SMA,EMA technical analysis, forecast prediction, by indicators ADX,MACD,RSI,CCI NASDAQ stock exchange
Daily price and charts and targets GuardionHealth Strong Daily Stock price targets for GuardionHealth GHSI are 3.22 and 3.28 | Daily Target 1 | 3.2 | | Daily Target 2 | 3.23 | | Daily Target 3 | 3.2633333333333 | | Daily Target 4 | 3.29 | | Daily Target 5 | 3.32 |
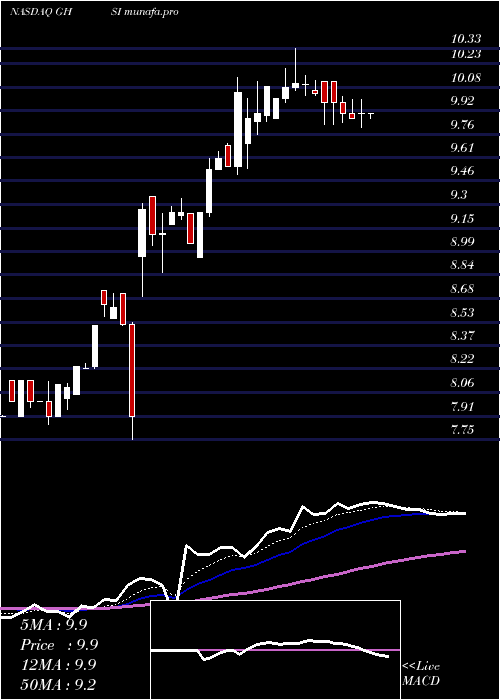
Daily price and volume Guardion Health
| Date |
Closing |
Open |
Range |
Volume |
Fri 11 October 2024 |
3.25 (-0.31%) |
3.27 |
3.24 - 3.30 |
0.6712 times |
Thu 10 October 2024 |
3.26 (-0.31%) |
3.26 |
3.23 - 3.30 |
0.2697 times |
Wed 09 October 2024 |
3.27 (0.93%) |
3.23 |
3.23 - 3.30 |
0.0623 times |
Tue 08 October 2024 |
3.24 (-0.31%) |
3.26 |
3.23 - 3.33 |
0.2169 times |
Mon 07 October 2024 |
3.25 (-1.52%) |
3.33 |
3.23 - 3.40 |
0.5869 times |
Fri 04 October 2024 |
3.30 (-5.71%) |
3.41 |
3.30 - 3.55 |
0.2235 times |
Thu 03 October 2024 |
3.50 (7.69%) |
3.25 |
3.25 - 3.61 |
0.9694 times |
Wed 02 October 2024 |
3.25 (0.62%) |
3.22 |
3.22 - 3.31 |
0.9724 times |
Tue 01 October 2024 |
3.23 (-41.7%) |
3.54 |
3.04 - 3.57 |
5.5668 times |
Mon 30 September 2024 |
5.54 (-4.15%) |
5.60 |
5.51 - 5.83 |
0.4609 times |
Fri 27 September 2024 |
5.78 (-0.86%) |
5.92 |
5.66 - 5.99 |
0.2301 times |
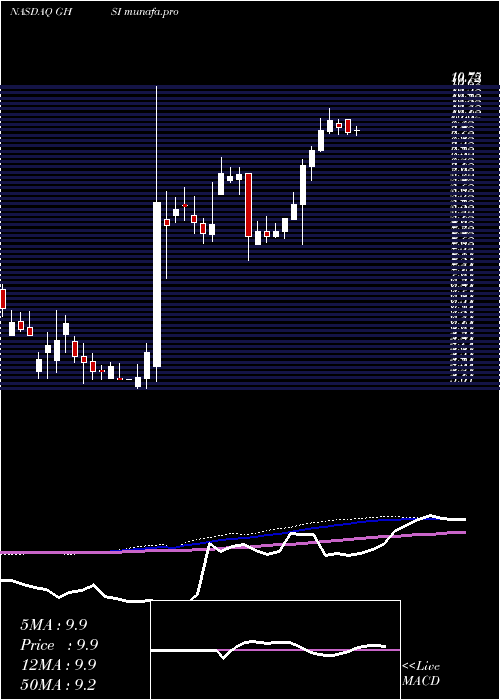
Weekly price and charts GuardionHealth Strong weekly Stock price targets for GuardionHealth GHSI are 3.16 and 3.33 | Weekly Target 1 | 3.12 | | Weekly Target 2 | 3.19 | | Weekly Target 3 | 3.2933333333333 | | Weekly Target 4 | 3.36 | | Weekly Target 5 | 3.46 |
Weekly price and volumes for Guardion Health
| Date |
Closing |
Open |
Range |
Volume |
Fri 11 October 2024 |
3.25 (-1.52%) |
3.33 |
3.23 - 3.40 |
0.314 times |
Fri 04 October 2024 |
3.30 (-42.91%) |
5.60 |
3.04 - 5.83 |
1.4237 times |
Fri 27 September 2024 |
5.78 (-47.12%) |
10.76 |
5.52 - 11.24 |
0.841 times |
Fri 20 September 2024 |
10.93 (10.29%) |
9.98 |
9.76 - 11.34 |
0.2762 times |
Fri 13 September 2024 |
9.91 (-25.21%) |
12.33 |
9.25 - 12.34 |
0.6564 times |
Fri 06 September 2024 |
13.25 (-4.47%) |
14.67 |
12.28 - 15.10 |
0.9795 times |
Fri 30 August 2024 |
13.87 (0%) |
13.10 |
12.90 - 14.93 |
0.5298 times |
Fri 30 August 2024 |
13.87 (-22.94%) |
16.20 |
11.01 - 16.49 |
3.2312 times |
Fri 23 August 2024 |
18.00 (100%) |
8.86 |
8.86 - 18.00 |
1.7222 times |
Fri 16 August 2024 |
9.00 (-3.23%) |
9.25 |
8.86 - 9.57 |
0.026 times |
Fri 09 August 2024 |
9.30 (-3.33%) |
9.34 |
9.30 - 9.58 |
0.0104 times |
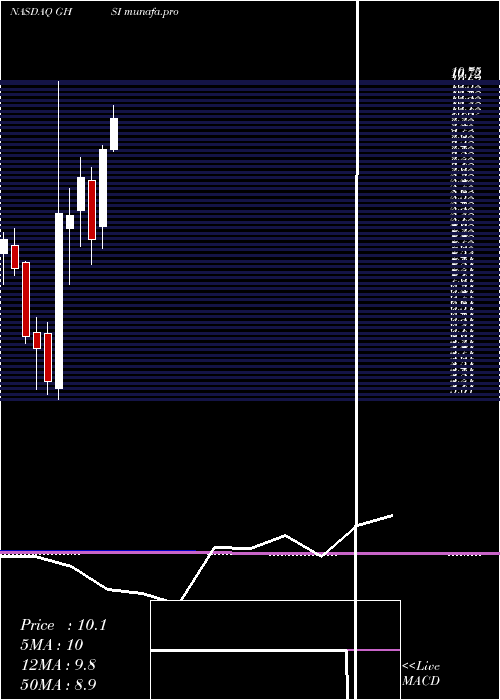
Monthly price and charts GuardionHealth Strong monthly Stock price targets for GuardionHealth GHSI are 2.86 and 3.43 | Monthly Target 1 | 2.73 | | Monthly Target 2 | 2.99 | | Monthly Target 3 | 3.3 | | Monthly Target 4 | 3.56 | | Monthly Target 5 | 3.87 |
Monthly price and volumes Guardion Health
| Date |
Closing |
Open |
Range |
Volume |
Fri 11 October 2024 |
3.25 (-41.34%) |
3.54 |
3.04 - 3.61 |
0.5943 times |
Mon 30 September 2024 |
5.54 (-60.06%) |
14.67 |
5.51 - 15.10 |
1.0158 times |
Fri 30 August 2024 |
13.87 (43.58%) |
9.41 |
8.86 - 18.00 |
1.9814 times |
Wed 31 July 2024 |
9.66 (-3.78%) |
9.79 |
9.36 - 10.16 |
0.0273 times |
Fri 28 June 2024 |
10.04 (5.35%) |
9.53 |
9.50 - 10.33 |
0.0543 times |
Fri 31 May 2024 |
9.53 (20.63%) |
8.14 |
7.75 - 9.60 |
0.0807 times |
Tue 30 April 2024 |
7.90 (-12.51%) |
8.97 |
7.45 - 9.20 |
0.1176 times |
Thu 28 March 2024 |
9.03 (8.27%) |
8.42 |
7.77 - 9.39 |
0.1925 times |
Thu 29 February 2024 |
8.34 (-0.48%) |
8.10 |
7.09 - 8.82 |
0.521 times |
Wed 31 January 2024 |
8.38 (56.93%) |
5.21 |
5.01 - 10.75 |
5.4149 times |
Fri 29 December 2023 |
5.34 (-9.95%) |
6.21 |
5.11 - 6.40 |
0.0459 times |
DMA SMA EMA moving averages of Guardion Health GHSI
DMA (daily moving average) of Guardion Health GHSI
| DMA period | DMA value | | 5 day DMA | 3.25 | | 12 day DMA | 3.89 | | 20 day DMA | 6.11 | | 35 day DMA | 8.75 | | 50 day DMA | 9.12 | | 100 day DMA | 9.44 | | 150 day DMA | 9.09 | | 200 day DMA | 8.54 | EMA (exponential moving average) of Guardion Health GHSI
| EMA period | EMA current | EMA prev | EMA prev2 | | 5 day EMA | 3.34 | 3.39 | 3.46 | | 12 day EMA | 4.33 | 4.53 | 4.76 | | 20 day EMA | 5.58 | 5.83 | 6.1 | | 35 day EMA | 7.03 | 7.25 | 7.49 | | 50 day EMA | 8.57 | 8.79 | 9.02 |
SMA (simple moving average) of Guardion Health GHSI
| SMA period | SMA current | SMA prev | SMA prev2 | | 5 day SMA | 3.25 | 3.26 | 3.31 | | 12 day SMA | 3.89 | 4.12 | 4.4 | | 20 day SMA | 6.11 | 6.44 | 6.78 | | 35 day SMA | 8.75 | 9.18 | 9.41 | | 50 day SMA | 9.12 | 9.24 | 9.37 | | 100 day SMA | 9.44 | 9.5 | 9.55 | | 150 day SMA | 9.09 | 9.12 | 9.15 | | 200 day SMA | 8.54 | 8.55 | 8.56 |
|
|
