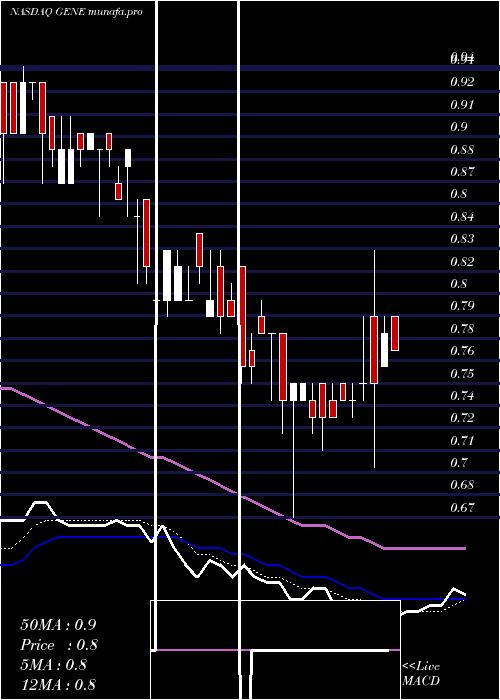
GeneticTechnologies GENE full analysis,charts,indicators,moving averages,SMA,DMA,EMA,ADX,MACD,RSIGenetic Technologies GENE WideScreen charts, DMA,SMA,EMA technical analysis, forecast prediction, by indicators ADX,MACD,RSI,CCI NASDAQ stock exchange
operates under Health Care sector & deals in Biotechnology Biological Products No Diagnostic Substances
Daily price and charts and targets GeneticTechnologies Strong Daily Stock price targets for GeneticTechnologies GENE are 0.76 and 0.78 | Daily Target 1 | 0.76 | | Daily Target 2 | 0.76 | | Daily Target 3 | 0.77666666666667 | | Daily Target 4 | 0.78 | | Daily Target 5 | 0.8 |
Daily price and volume Genetic Technologies
| Date |
Closing |
Open |
Range |
Volume |
Wed 16 October 2024 |
0.77 (-1.28%) |
0.79 |
0.77 - 0.79 |
1.1839 times |
Tue 15 October 2024 |
0.78 (4%) |
0.76 |
0.76 - 0.79 |
0.8853 times |
Mon 14 October 2024 |
0.75 (0%) |
0.79 |
0.70 - 0.83 |
1.9906 times |
Fri 11 October 2024 |
0.75 (1.35%) |
0.75 |
0.74 - 0.79 |
1.8701 times |
Thu 10 October 2024 |
0.74 (0%) |
0.74 |
0.73 - 0.75 |
0.7334 times |
Wed 09 October 2024 |
0.74 (1.37%) |
0.75 |
0.74 - 0.75 |
0.3772 times |
Tue 08 October 2024 |
0.73 (0%) |
0.74 |
0.73 - 0.75 |
1.4667 times |
Mon 07 October 2024 |
0.73 (0%) |
0.75 |
0.71 - 0.75 |
0.9691 times |
Fri 04 October 2024 |
0.73 (-2.67%) |
0.74 |
0.72 - 0.75 |
0.3772 times |
Thu 03 October 2024 |
0.75 (0%) |
0.74 |
0.74 - 0.75 |
0.1467 times |
Wed 02 October 2024 |
0.75 (1.35%) |
0.74 |
0.67 - 0.75 |
1.2939 times |
Weekly price and charts GeneticTechnologies Strong weekly Stock price targets for GeneticTechnologies GENE are 0.67 and 0.8 | Weekly Target 1 | 0.64 | | Weekly Target 2 | 0.7 | | Weekly Target 3 | 0.76666666666667 | | Weekly Target 4 | 0.83 | | Weekly Target 5 | 0.9 |
Weekly price and volumes for Genetic Technologies
| Date |
Closing |
Open |
Range |
Volume |
Wed 16 October 2024 |
0.77 (2.67%) |
0.79 |
0.70 - 0.83 |
0.9695 times |
Fri 11 October 2024 |
0.75 (2.74%) |
0.75 |
0.71 - 0.79 |
1.2936 times |
Fri 04 October 2024 |
0.73 (-6.41%) |
0.78 |
0.67 - 0.78 |
1.0759 times |
Fri 27 September 2024 |
0.78 (-2.5%) |
0.82 |
0.75 - 0.83 |
1.226 times |
Fri 20 September 2024 |
0.80 (0%) |
0.80 |
0.79 - 0.84 |
1.8615 times |
Fri 13 September 2024 |
0.80 (-10.11%) |
0.87 |
0.79 - 0.89 |
0.6017 times |
Fri 06 September 2024 |
0.89 (0%) |
0.90 |
0.85 - 0.90 |
0.4216 times |
Fri 30 August 2024 |
0.89 (0%) |
0.87 |
0.87 - 0.91 |
0.0713 times |
Fri 30 August 2024 |
0.89 (-1.11%) |
0.90 |
0.87 - 0.94 |
0.5697 times |
Fri 23 August 2024 |
0.90 (13.92%) |
0.81 |
0.78 - 0.93 |
1.9091 times |
Fri 16 August 2024 |
0.79 (1.28%) |
0.80 |
0.69 - 0.87 |
2.6484 times |

Monthly price and charts GeneticTechnologies Strong monthly Stock price targets for GeneticTechnologies GENE are 0.64 and 0.8 | Monthly Target 1 | 0.6 | | Monthly Target 2 | 0.68 | | Monthly Target 3 | 0.75666666666667 | | Monthly Target 4 | 0.84 | | Monthly Target 5 | 0.92 |
Monthly price and volumes Genetic Technologies
| Date |
Closing |
Open |
Range |
Volume |
Wed 16 October 2024 |
0.77 (-1.28%) |
0.78 |
0.67 - 0.83 |
0.2878 times |
Mon 30 September 2024 |
0.78 (-12.36%) |
0.90 |
0.74 - 0.90 |
0.4055 times |
Fri 30 August 2024 |
0.89 (8.54%) |
0.83 |
0.69 - 0.94 |
0.6345 times |
Wed 31 July 2024 |
0.82 (-45.33%) |
1.42 |
0.75 - 1.58 |
2.1912 times |
Fri 28 June 2024 |
1.50 (-24.24%) |
2.06 |
1.38 - 2.06 |
1.6121 times |
Fri 31 May 2024 |
1.98 (-14.66%) |
2.40 |
1.67 - 2.49 |
2.0681 times |
Tue 30 April 2024 |
2.32 (-19.72%) |
2.95 |
2.10 - 3.59 |
0.7596 times |
Thu 28 March 2024 |
2.89 (35.68%) |
2.28 |
2.15 - 2.97 |
0.9183 times |
Thu 29 February 2024 |
2.13 (9.23%) |
1.99 |
1.80 - 2.15 |
0.5996 times |
Wed 31 January 2024 |
1.95 (-18.75%) |
2.48 |
1.81 - 2.80 |
0.5231 times |
Fri 29 December 2023 |
2.40 (228.77%) |
0.73 |
0.52 - 3.18 |
2.191 times |

DMA SMA EMA moving averages of Genetic Technologies GENE
DMA (daily moving average) of Genetic Technologies GENE
| DMA period | DMA value | | 5 day DMA | 0.76 | | 12 day DMA | 0.75 | | 20 day DMA | 0.76 | | 35 day DMA | 0.8 | | 50 day DMA | 0.81 | | 100 day DMA | 1.07 | | 150 day DMA | 1.55 | | 200 day DMA | 1.72 | EMA (exponential moving average) of Genetic Technologies GENE
| EMA period | EMA current | EMA prev | EMA prev2 | | 5 day EMA | 0.76 | 0.75 | 0.74 | | 12 day EMA | 0.76 | 0.76 | 0.76 | | 20 day EMA | 0.78 | 0.78 | 0.78 | | 35 day EMA | 0.81 | 0.81 | 0.81 | | 50 day EMA | 0.82 | 0.82 | 0.82 |
SMA (simple moving average) of Genetic Technologies GENE
| SMA period | SMA current | SMA prev | SMA prev2 | | 5 day SMA | 0.76 | 0.75 | 0.74 | | 12 day SMA | 0.75 | 0.75 | 0.75 | | 20 day SMA | 0.76 | 0.76 | 0.77 | | 35 day SMA | 0.8 | 0.81 | 0.81 | | 50 day SMA | 0.81 | 0.81 | 0.81 | | 100 day SMA | 1.07 | 1.08 | 1.09 | | 150 day SMA | 1.55 | 1.57 | 1.58 | | 200 day SMA | 1.72 | 1.73 | 1.74 |
|
|
