GcmGrosvenor GCMGW full analysis,charts,indicators,moving averages,SMA,DMA,EMA,ADX,MACD,RSIGcm Grosvenor GCMGW WideScreen charts, DMA,SMA,EMA technical analysis, forecast prediction, by indicators ADX,MACD,RSI,CCI NASDAQ stock exchange
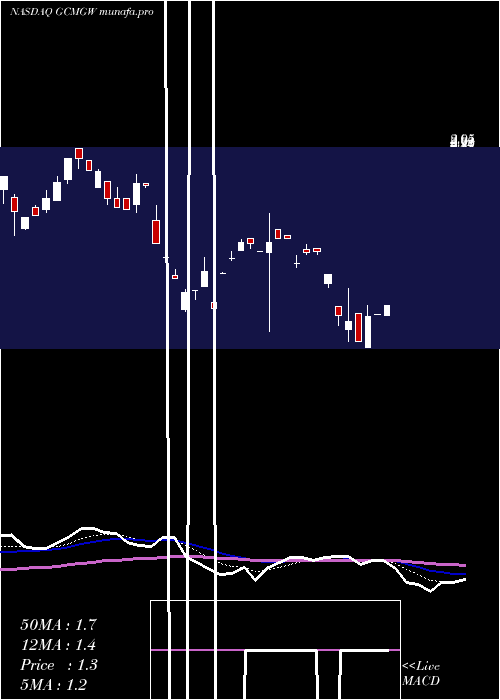
Daily price and charts and targets GcmGrosvenor Strong Daily Stock price targets for GcmGrosvenor GCMGW are 0.11 and 0.16 | Daily Target 1 | 0.1 | | Daily Target 2 | 0.12 | | Daily Target 3 | 0.14666666666667 | | Daily Target 4 | 0.17 | | Daily Target 5 | 0.2 |
Daily price and volume Gcm Grosvenor
| Date |
Closing |
Open |
Range |
Volume |
Thu 30 October 2025 |
0.15 (-11.76%) |
0.17 |
0.12 - 0.17 |
5.4548 times |
Wed 29 October 2025 |
0.17 (-22.73%) |
0.17 |
0.17 - 0.17 |
0.0081 times |
Tue 28 October 2025 |
0.22 (-8.33%) |
0.22 |
0.22 - 0.22 |
0.0403 times |
Mon 27 October 2025 |
0.24 (-11.11%) |
0.23 |
0.23 - 0.28 |
0.8265 times |
Fri 24 October 2025 |
0.27 (3.85%) |
0.23 |
0.23 - 0.31 |
0.4409 times |
Thu 23 October 2025 |
0.26 (-13.33%) |
0.26 |
0.26 - 0.26 |
0.0081 times |
Wed 22 October 2025 |
0.30 (36.36%) |
0.26 |
0.26 - 0.30 |
0.1209 times |
Tue 21 October 2025 |
0.22 (29.41%) |
0.20 |
0.20 - 0.30 |
0.895 times |
Mon 20 October 2025 |
0.17 (6.25%) |
0.17 |
0.17 - 0.20 |
0.8991 times |
Fri 17 October 2025 |
0.16 (0%) |
0.17 |
0.15 - 0.17 |
1.3063 times |
Thu 16 October 2025 |
0.16 (-33.33%) |
0.20 |
0.16 - 0.20 |
0.2016 times |
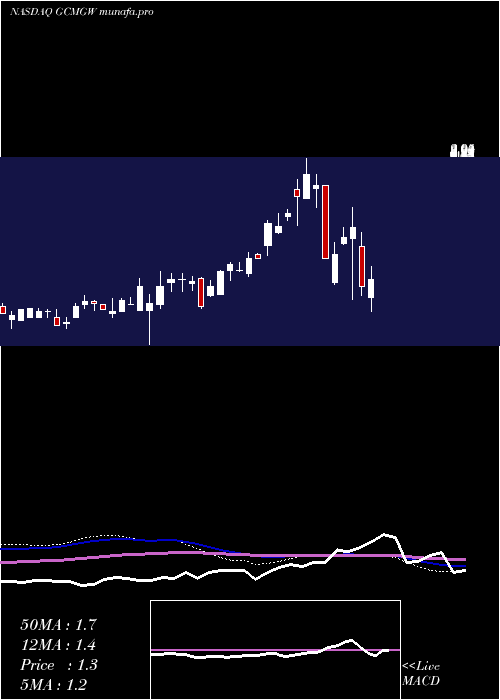
Weekly price and charts GcmGrosvenor Strong weekly Stock price targets for GcmGrosvenor GCMGW are 0.06 and 0.22 | Weekly Target 1 | 0.02 | | Weekly Target 2 | 0.09 | | Weekly Target 3 | 0.18333333333333 | | Weekly Target 4 | 0.25 | | Weekly Target 5 | 0.34 |
Weekly price and volumes for Gcm Grosvenor
| Date |
Closing |
Open |
Range |
Volume |
Thu 30 October 2025 |
0.15 (-44.44%) |
0.23 |
0.12 - 0.28 |
0.994 times |
Fri 24 October 2025 |
0.27 (68.75%) |
0.17 |
0.17 - 0.31 |
0.3713 times |
Fri 17 October 2025 |
0.16 (-27.27%) |
0.18 |
0.13 - 0.28 |
0.58 times |
Fri 10 October 2025 |
0.22 (-56.86%) |
0.47 |
0.12 - 0.56 |
0.1804 times |
Fri 03 October 2025 |
0.51 (-43.33%) |
0.75 |
0.37 - 0.75 |
3.2404 times |
Thu 25 September 2025 |
0.90 (-41.18%) |
1.41 |
0.90 - 1.52 |
0.7427 times |
Fri 19 September 2025 |
1.53 (13.33%) |
1.38 |
1.30 - 1.73 |
2.4028 times |
Fri 12 September 2025 |
1.35 (13.45%) |
1.35 |
1.24 - 1.47 |
0.4806 times |
Fri 05 September 2025 |
1.19 (-17.93%) |
1.34 |
1.04 - 1.34 |
0.9048 times |
Fri 29 August 2025 |
1.45 (0%) |
1.44 |
1.39 - 1.50 |
0.1032 times |
Fri 29 August 2025 |
1.45 (-8.81%) |
1.55 |
1.39 - 1.56 |
0.5654 times |
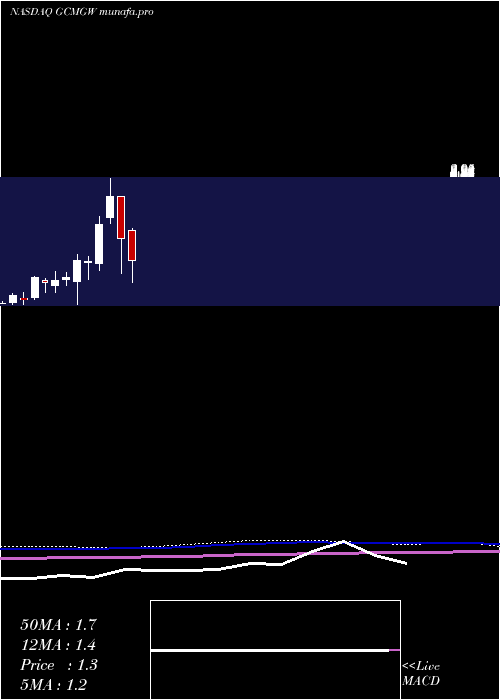
Monthly price and charts GcmGrosvenor Strong monthly Stock price targets for GcmGrosvenor GCMGW are -0.12 and 0.39 | Monthly Target 1 | -0.21 | | Monthly Target 2 | -0.03 | | Monthly Target 3 | 0.3 | | Monthly Target 4 | 0.48 | | Monthly Target 5 | 0.81 |
Monthly price and volumes Gcm Grosvenor
| Date |
Closing |
Open |
Range |
Volume |
Thu 30 October 2025 |
0.15 (-71.7%) |
0.51 |
0.12 - 0.63 |
1.3408 times |
Tue 30 September 2025 |
0.53 (-63.45%) |
1.34 |
0.53 - 1.73 |
1.1376 times |
Fri 29 August 2025 |
1.45 (126.56%) |
0.60 |
0.55 - 1.68 |
0.4899 times |
Thu 31 July 2025 |
0.64 (0%) |
0.64 |
0.55 - 0.98 |
0.6236 times |
Mon 30 June 2025 |
0.64 (-50%) |
1.12 |
0.51 - 1.36 |
0.2294 times |
Fri 30 May 2025 |
1.28 (9.4%) |
1.37 |
1.00 - 1.59 |
1.354 times |
Wed 30 April 2025 |
1.17 (-32.76%) |
1.89 |
0.84 - 1.94 |
1.2783 times |
Mon 31 March 2025 |
1.74 (-32.56%) |
2.58 |
1.02 - 2.58 |
0.3166 times |
Fri 28 February 2025 |
2.58 (27.72%) |
2.15 |
2.03 - 2.95 |
0.9437 times |
Fri 31 January 2025 |
2.02 (60.32%) |
1.23 |
1.09 - 2.19 |
2.2859 times |
Tue 31 December 2024 |
1.26 (-2.33%) |
1.24 |
0.90 - 1.37 |
0.712 times |
DMA SMA EMA moving averages of Gcm Grosvenor GCMGW
DMA (daily moving average) of Gcm Grosvenor GCMGW
| DMA period | DMA value | | 5 day DMA | 0.21 | | 12 day DMA | 0.21 | | 20 day DMA | 0.25 | | 35 day DMA | 0.63 | | 50 day DMA | 0.86 | | 100 day DMA | 0.89 | | 150 day DMA | 1.06 | | 200 day DMA | 1.27 | EMA (exponential moving average) of Gcm Grosvenor GCMGW
| EMA period | EMA current | EMA prev | EMA prev2 | | 5 day EMA | 0.2 | 0.22 | 0.24 | | 12 day EMA | 0.23 | 0.25 | 0.27 | | 20 day EMA | 0.33 | 0.35 | 0.37 | | 35 day EMA | 0.57 | 0.6 | 0.63 | | 50 day EMA | 0.84 | 0.87 | 0.9 |
SMA (simple moving average) of Gcm Grosvenor GCMGW
| SMA period | SMA current | SMA prev | SMA prev2 | | 5 day SMA | 0.21 | 0.23 | 0.26 | | 12 day SMA | 0.21 | 0.22 | 0.22 | | 20 day SMA | 0.25 | 0.27 | 0.28 | | 35 day SMA | 0.63 | 0.66 | 0.69 | | 50 day SMA | 0.86 | 0.89 | 0.91 | | 100 day SMA | 0.89 | 0.9 | 0.91 | | 150 day SMA | 1.06 | 1.07 | 1.08 | | 200 day SMA | 1.27 | 1.28 | 1.28 |
|
|
